 Markers:
Show
Hide
Markers:
Show
Hide
Mouse-over the markers to view the TC name, click the marker to load the individual map.
| Tropical Cyclones
[Index] | Australian Region Tropical Cyclone Season 1927-1928 | ||
| Season 1927-1928 Summaries: [BoM-AU] | |||
|
Mouse-over the markers to view the TC name, click the marker to load the individual map.
Markers:
Show
Hide
|
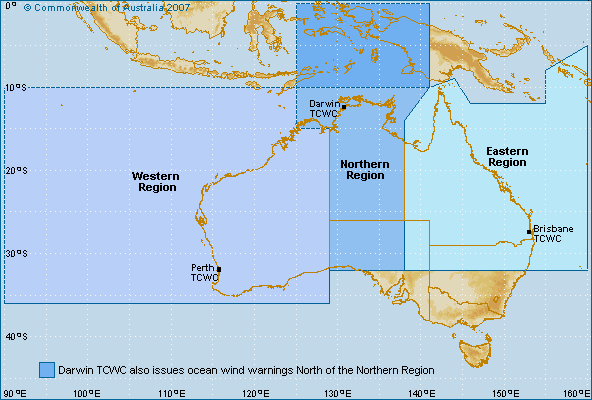
Bureau of Meteorology (BoM) Tropical Cyclone Data
Generally includes all tropical cyclones if the track commenced or moved into the Australian warning areas (between 90 E and 160 E). |
| Cyclone Name | Map ID |
Cyclone Number |
Basin | Date Range (UTC) | Min CP |
Max Winds |
Tracking Map and data |
|---|---|---|---|---|---|---|---|
| 192728_01 | 1 | 86 / 192728_01 | SPAC | 28 Nov 1927 - 30 Nov 1927 | 999 | Tropical Cyclone 192728_01 | |
| 192728_02 | 2 | 87 / 192728_02 | SIO | 12 Feb 1928 - 13 Feb 1928 | Tropical Cyclone 192728_02 | ||
| 192728_03 | 3 | 88 / 192728_03 | SPAC | 12 Feb 1928 - 14 Feb 1928 | 992 | Tropical Cyclone 192728_03 | |
| 192728_04 | 4 | 89 / 192728_04 | SPAC | 01 Mar 1928 - 08 Mar 1928 | 996 | Tropical Cyclone 192728_04 | |
| 192728_05 | 5 | 90 / 192728_05 | SIO | 26 Mar 1928 - 27 Mar 1928 | 999 | Tropical Cyclone 192728_05 | |
| 192728_06 | 6 | 91 / 192728_06 | SPAC | 18 Apr 1928 - 22 Apr 1928 | 1002 | Tropical Cyclone 192728_06 |
Minimum central pressure (CP) in hPa. Maximum winds are 10-min average in knots.
Tropical cyclone tracks developed by Michael Bath using data from the Bureau of Meteorology and Google Maps.
|
Document: bom_1927_1928_australian_region_tropical_cyclones.htm
Updated: 6 February 2026 [Australian Severe Weather index] [Copyright Notice] [Email Contacts] [Search This Site] [Privacy Policy] |