[Index]
Tropical Cyclone Plotting Information / Intensity Scale Comparison
| Tropical
Cyclones
[Index] |
Tropical Cyclone Plotting Information / Intensity Scale Comparison |
Cyclones are generally only included if the track commenced or moved into the Australian tropical cyclone warning areas (between 90 and 160 degrees East).
Listing of all BoM tropical cyclones : this includes all tropical cyclones tracked by the BoM since the 1906/07 season. Historical data is reviewed once updated best track data becomes available.
Australian Region (AU): 90E to 180E (this is a best fit region and not an official TC basin)
South Indian Ocean (SIO): 15E to 135E
South Pacific Ocean (SPAC): 135E to 110W
Southern Hemisphere (SH): 15E to 110W
Listing of all JTWC tropical cyclones : this includes all tropical cyclones in the JTWC best track dataset since the 1944/45 season. Annual data for the past year is typically released in March or April.
Australian Region (AU): 90E to 180E (this is a best fit region and not an official TC basin)
South Indian Ocean (SIO): 15E to 135E
South Pacific Ocean (SPAC): 135E to 110W
Southern Hemisphere (SH): 15E to 110W
Listing of all operational storms : this includes all tropical cyclones, tropical lows, tropical depressions and hybrid lows tracked by the various tropical cyclone warning agencies since the 1997/98 season. Tracks are typically updated monthly.

The definitions in the following table are from the Southern Hemisphere classification system (as used by the Australian BoM), and all maps on this website have been plotted using it. JTWC best track data has been converted from 1-minute average winds in knots, to the Southern Hemisphere standard of 10-minute average winds in knots, then converted to km/h. The conversion used is "JTWC 1-min" * 0.88 * 1.852. Operational data is also converted using this formula where 10-min average winds are not available.
The Hurricane and Typhoon classification systems are different.
| Storm Type | Pressure (hPa) | Max Gusts (km/h) | 10-min Ave Winds (km/h) | Dvorak Rating | Effects during landfall |
|---|---|---|---|---|---|
| Tropical Low | >= 996 | < 63 | 2.0 - 2.5 | ||
| Category 1 Tropical Cyclone | 986 - 995 | < 125 | 63 - 88 | 3.0 - 3.5 | Negligible house damage. Damage to some crops, trees and caravans. |
| Category 2 Tropical Cyclone | 971 - 985 | 125 - 164 | 89 - 117 | 4.0 - 4.5 | Minor house damage. Significant damage to signs, trees and caravans. Heavy damage to some crops. Risk of power failure. Small craft may break moorings. |
| Category 3 Tropical Cyclone | 956 - 970 | 165 - 224 | 118 - 159 | 5.0 - 5.5 | Some roof and structural damage. Some caravans destroyed. Power failures likely. |
| Category 4 Tropical Cyclone | 930 - 955 | 225 - 279 | 160 - 199 | 6.0 - 7.0 | Significant roofing loss and structural damage. Many caravans destroyed and blown away. Dangerous airbourne debris. Widespread power failures. |
| Category 5 Tropical Cyclone | <= 929 | 280 + | 200 + | 7.5 - 8.0 | Extremely dangerous with widespread destruction. |
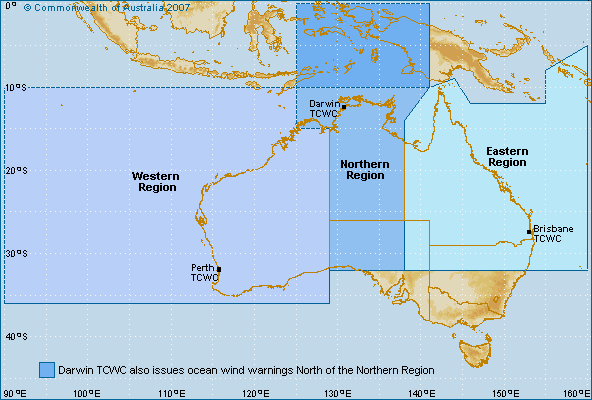
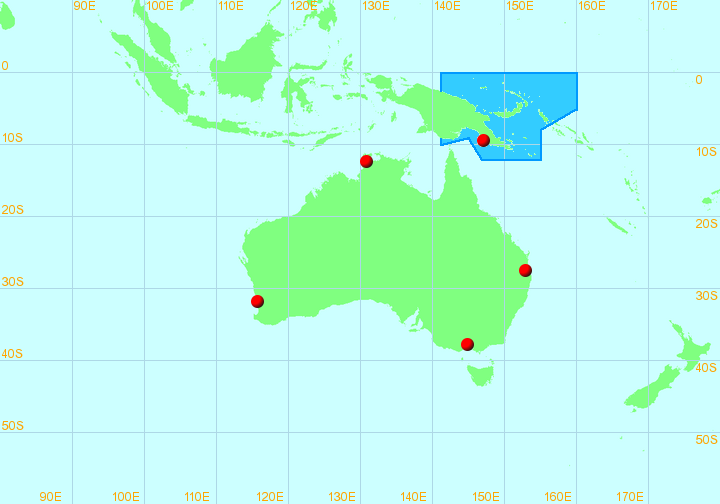
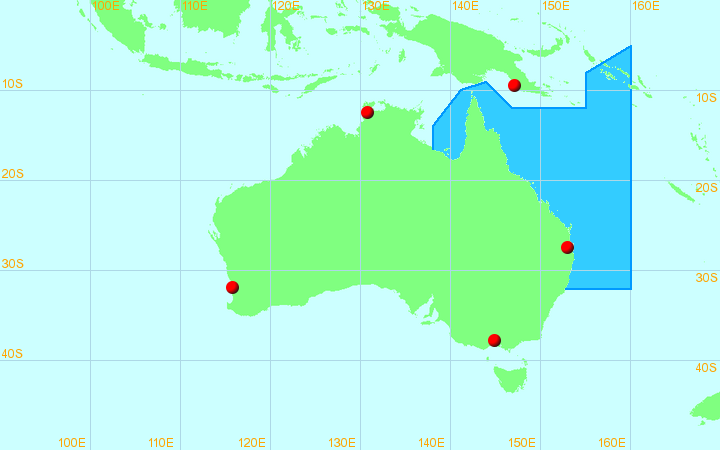
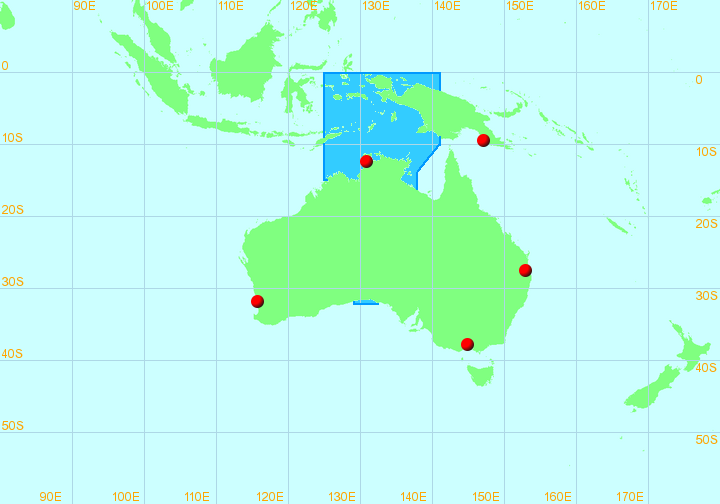
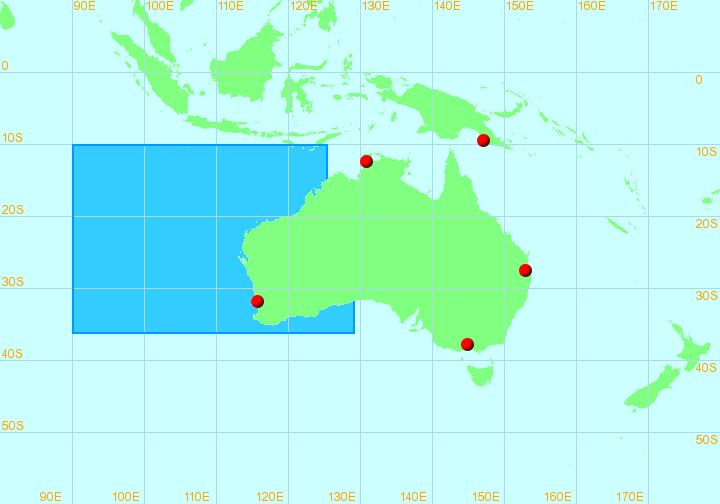
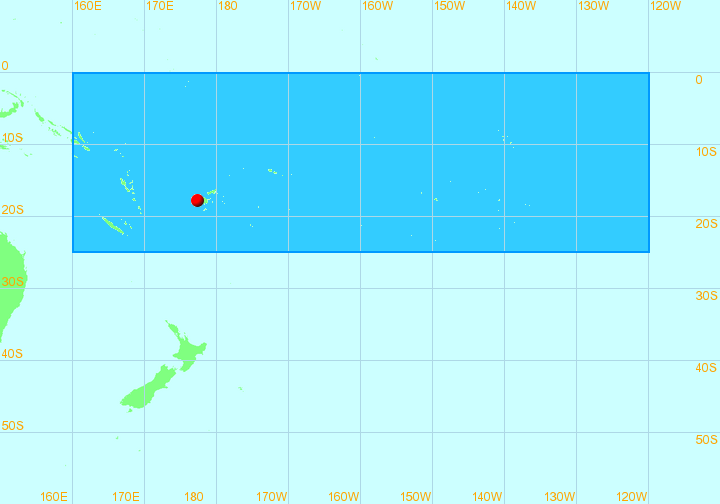
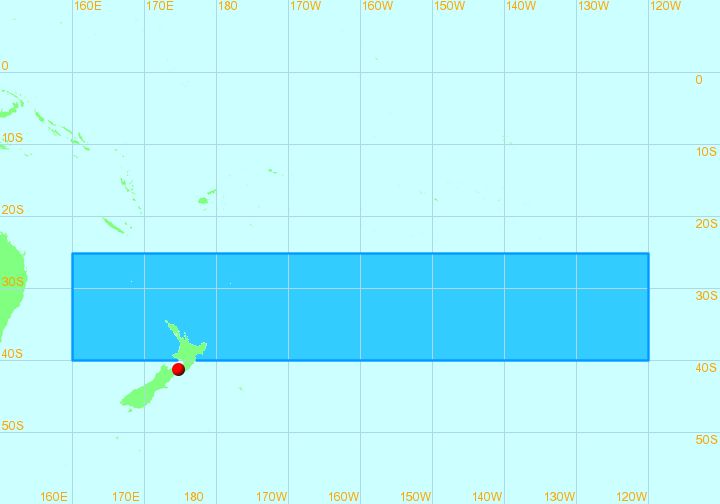
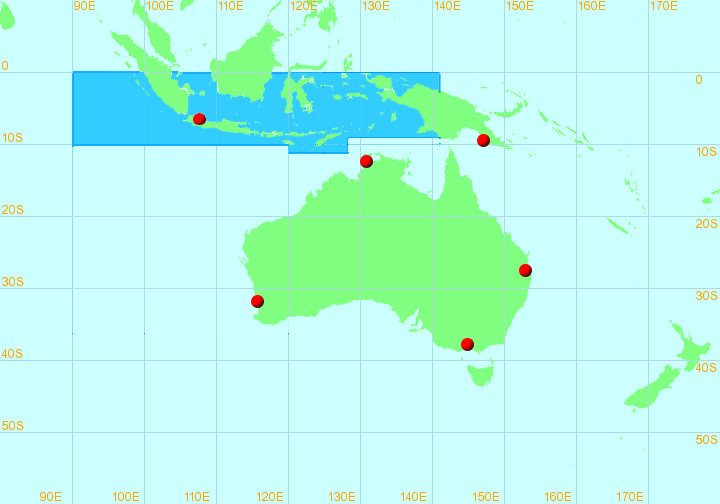
The following maps from the World Meteorological Organization show the official warning centres of the Southern Hemisphere.
TCWC-Port Moresby/Papua New Guinea
TCWC-Brisbane/Australia
TCWC-Darwin/Australia
TCWC-Perth/Australia
RSMC Nadi-Tropical Cyclone Centre/Fiji
TCWC-Wellington/New Zealand
TCWC-Jakarta
La Reunion-Tropical Cyclone Centre/Meteo-France
Both the U. S. National Weather Service and Australia's Bureau of Meteorology (BoM) employ a 5-point scale by which to alert the public of the general effects which can be expected from tropical cyclones of varying intensities. In both systems tropical cyclones are classified from Category 1 (the weakest) to Category 5 (the strongest), and each scale seems to have been adopted enthusiastically by the general public in both Australia and in the United States.
However, the scales are very different in their conception and in the boundaries between their respective categories. The Saffir/Simpson scale, used in the United States, is used for classifying tropical cyclones which have reached hurricane intensity while the Australian scale is utilized for all tropical cyclones of gale intensity or higher. Nowadays, anyone anywhere in the world with internet access can follow tropical cyclones in great detail, and there are many persons who delight in tracking and discussing storms in all oceanic basins. Considerable confusion has sometimes arisen when, for example, someone in the U. S. is following an Australian cyclone and assuming that the category given in the BoM warnings (and often aired in the international news media) is equivalent to its Saffir/Simpson category.
The following chart summarizes the salient characteristics of the two scales:
| Characteristic | Saffir/Simpson | Australian |
|---|---|---|
| Beginning Point | Hurricane force | Gale force |
| Wind Parameter | Sustained wind (1-min avg) | Peak gusts |
| Wind Velocity Units | Statute miles-per-hour | Kilometres-per-hour |
My purpose here is to provide information whereby persons interested in comparing the two scales can easily do so. Table 1 defines the Saffir/Simpson Scale in terms of the 1-min avg maximum sustained wind (MSW) in statute miles-per-hour (mph) while Table 2 defines the Australian Cyclone Severity Scale in terms of peak wind gusts in kilometres-per-hour (km/hr). I have not included the narrative describing the degree and type of damage which can be expected with each category in both scales. Also, in both tables I have included the qualifying wind velocity in nautical miles-per-hour (kts) along with the nominal central pressure range in millibars (mb)--numerically equal to hectopascals (hPa).
Table 1 - Saffir/Simpson Scale
| Category S/S | 1-min avg MSW (mph) | 1-min avg MSW (kts) | Central Pressure (mb) |
|---|---|---|---|
| 1 | 74 - 95 | 64 - 82 | >= 980 |
| 2 | 96 - 110 | 83 - 95 | 965 - 979 |
| 3 | 111 - 130 | 96 - 113 | 945 - 964 |
| 4 | 131 - 155 | 114 - 135 | 920 - 944 |
| 5 | >= 156 | >= 136 | <= 919 |
Table 2 - Australian Cyclone Severity Scale
| Category Aust | Peak gusts (km/hr) | Peak gusts (kts) | Central Pressure (hPa) |
|---|---|---|---|
| 1 | 90 - 124 | 49 - 67 | 986 - 995 |
| 2 | 125 - 169 | 68 - 91 | 971 - 985 |
| 3 | 170 - 224 | 92 - 121 | 956 - 970 |
| 4 | 225 - 279 | 122 - 150 | 930 - 955 |
| 5 | >= 280 | >= 151 | <= 929 |
The following two tables define each scale in terms of the other scale's parameters, i.e., the Saffir/Simpson scale is defined in terms of a 10-min avg MSW in kts, and peak gusts in kts and in km/hr (Table 3) while the Australian scale is defined in terms of a 10-min avg MSW in kts and a 1-min avg MSW in mph (Table 4).
Table 3 - Saffir/Simpson Scale in Terms of Australian Scale Parameters
| Category S/S | 10-min avg MSW (kts) | Peak gusts (kts) | Peak Gusts (km/hr) | Equivalent Aust Category |
|---|---|---|---|---|
| 1 | 56 - 72 | 79 - 101 | 146 - 190 | mid-2 to mid-3 |
| 2 | 73 - 84 | 102 - 118 | 191 - 220 | mid to high-3 |
| 3 | 85 - 99 | 119 - 140 | 221 - 260 | high-3 to mid-4 |
| 4 | 100 - 118 | 141 - 166 | 261 - 310 | mid-4 to mid-5 |
| 5 | >= 119 | >= 167 | >= 311 | mid to high-5 |
Table 4 - Australian Scale in Terms of Saffir/Simpson Scale Parameters
| Category Aust | 10-min avg MSW (kts) | 1-min avg MSW (kts) | 1-min avg MSW (mph) | Equivalent S/S Category |
|---|---|---|---|---|
| 1 | 34 - 47 | 38 - 54 | 44 - 62 | none |
| 2 | 48 - 64 | 55 - 73 | 63 - 84 | none to mid-1 |
| 3 | 65 - 85 | 74 - 96 | 85 - 111 | mid-1 to high-2 |
| 4 | 86 - 106 | 97 - 120 | 112 - 139 | low-3 to low-4 |
| 5 | >= 107 | >= 120 | >= 140 | mid-4 and up |
Finally, as an additional aid to comparison, I have included a table (Table 5) comparing each cyclone scale with the Dvorak scale, used extensively in estimating tropical cyclone intensity from visible and infrared satellite imagery. I have started the table with T2.0 since neither TPC/NHC nor the BoM TCWCs routinely issue advisories/ advices/warnings for systems less than that Dvorak rating. (See the key following the table for an explanation of the abbreviations used.)
Table 5 - Comparison of Dvorak Scale with Cyclone Scales
| Dvorak T-Number | MSW (1-min kts) | MSW (10-min kts) | TPC/NHC Category | Australian Category |
|---|---|---|---|---|
| T2.0 | 30 | 26 | TD | TL |
| T2.5 | 35 | 31 | TS | TL |
| T3.0 | 45 | 40 | TS | TC-1 |
| T3.5 | 55 | 48 | TS | TC-2 |
| T4.0 | 65 | 57 | H-1 | TC-2 |
| T4.5 | 77 | 68 | H-1 | TC-3 |
| T5.0 | 90 | 79 | H-2 | TC-3 |
| T5.5 | 102 | 90 | H-3 | TC-4 |
| T6.0 | 115 | 101 | H-4 | TC-4 |
| T6.5 | 127 | 112 | H-4 | TC-5 |
| T7.0 | 140 | 123 | H-5 | TC-5 |
| T7.5 | 155 | 136 | H-5 | TC-5 |
| T8.0 | 170 | 150 | H-5 | TC-5 |
  Key to Abbreviations:
  ---------------------
  TD      tropical depression
  TL      tropical LOW
  H-n     hurricane of Saffir/Simpson category "n"
  TC-n    tropical cyclone of category "n" on Australian scale
Most of the information presented above was obtained from the websites of Australia's Bureau of Meteorology and the Tropical Prediction Center/National Hurricane Center.
Perth Tropical Cyclone Warning Centre also has a Intensity Scale Comparison.
|
Document: tropical_cyclone_intensity_scale.htm
Updated: 9th December 2020 |
[Australian Severe Weather index] [Copyright Notice] [Email Contacts] [Search This Site] |