 Markers:
Show
Hide
Markers:
Show
Hide
Mouse-over the markers to view the TC name, click the marker to load the individual map.
| Tropical Cyclones
[Index] | Australian Region Tropical Cyclone Season 1971-1972 | ||
| Season 1971-1972 Summaries: [BoM-AU] [JTWC-AU] [JTWC-SIO] [JTWC-SPAC] [JTWC-SH] | |||
|
Mouse-over the markers to view the TC name, click the marker to load the individual map.
Markers:
Show
Hide
|
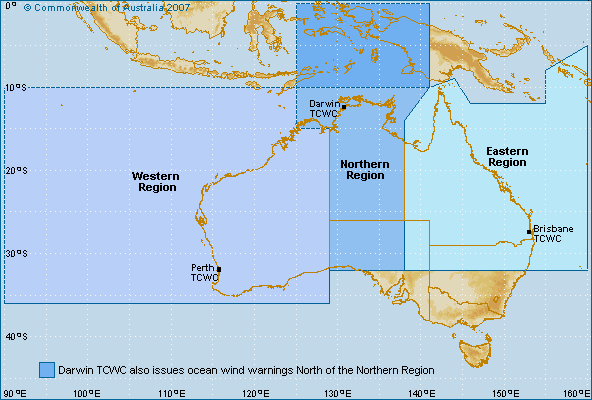
Bureau of Meteorology (BoM) Tropical Cyclone Data
Generally includes all tropical cyclones if the track commenced or moved into the Australian warning areas (between 90 E and 160 E). |
| Cyclone Name | Map ID |
Cyclone Number |
Basin | Date Range (UTC) | Min CP |
Max Winds |
Tracking Map and data |
|---|---|---|---|---|---|---|---|
| KITTY | 1 | 482 / 197172_02 | both | 02 Dec 1971 - 05 Dec 1971 | 1000 | Tropical Cyclone KITTY | |
| SALLY | 2 | 483 / 197172_04 | SIO | 03 Dec 1971 - 11 Dec 1971 | 950 | Tropical Cyclone SALLY | |
| ALTHEA | 3 | 484 / 197172_05 | SPAC | 19 Dec 1971 - 29 Dec 1971 | 952 | Tropical Cyclone ALTHEA | |
| BRONWYN | 4 | 485 / 197172_06 | SPAC | 02 Jan 1972 - 11 Jan 1972 | 993 | Tropical Cyclone BRONWYN | |
| CARLOTTA | 5 | 486 / 197172_07 | SPAC | 04 Jan 1972 - 21 Jan 1972 | 940 | Tropical Cyclone CARLOTTA | |
| WENDY | 6 | 487 / 197172_08 | SPAC | 04 Feb 1972 - 09 Feb 1972 | 942 | Tropical Cyclone WENDY | |
| DAISY | 7 | 488 / 197172_09 | SPAC | 05 Feb 1972 - 13 Feb 1972 | 959 | Tropical Cyclone DAISY | |
| TESSIE | 8 | 489 / 197172_10 | SIO | 20 Feb 1972 - 27 Feb 1972 | 950 | Tropical Cyclone TESSIE | |
| VICKY | 9 | 490 / 197172_11 | SIO | 24 Feb 1972 - 04 Mar 1972 | 960 | Tropical Cyclone VICKY | |
| ANGELA | 10 | 491 / 197172_12 | SIO | 29 Feb 1972 - 03 Mar 1972 | 994 | Tropical Cyclone ANGELA | |
| BELINDA | 11 | 492 / 197172_13 | SIO | 20 Mar 1972 - 29 Mar 1972 | 980 | Tropical Cyclone BELINDA | |
| EMILY | 12 | 493 / 197172_15 | SPAC | 27 Mar 1972 - 02 Apr 1972 | 942 | Tropical Cyclone EMILY | |
| CAROL | 13 | 494 / 197172_16 | SIO | 06 Apr 1972 - 14 Apr 1972 | 965 | Tropical Cyclone CAROL | |
| FAITH | 14 | 495 / 197172_17 | SPAC | 10 Apr 1972 - 24 Apr 1972 | 990 | Tropical Cyclone FAITH | |
| GAIL | 15 | 496 / 197172_18 | SPAC | 11 Apr 1972 - 17 Apr 1972 | 945 | Tropical Cyclone GAIL | |
| HANNAH | 16 | 497 / 197172_19 | SPAC | 07 May 1972 - 11 May 1972 | 970 | Tropical Cyclone HANNAH | |
| IDA | 17 | 498 / 197172_20 | SPAC | 29 May 1972 - 03 Jun 1972 | 970 | Tropical Cyclone IDA |
Minimum central pressure (CP) in hPa. Maximum winds are 10-min average in knots.
Tropical cyclone tracks developed by Michael Bath using data from the Bureau of Meteorology and Google Maps.
|
Document: bom_1971_1972_australian_region_tropical_cyclones.htm
Updated: 6 February 2026 [Australian Severe Weather index] [Copyright Notice] [Email Contacts] [Search This Site] [Privacy Policy] |