and Chasing
[Index][Archives]
Severe Storm Chase in Southeast Queensland: Monday 26th December 2005
Report compiled by Michael Bath and Jimmy Deguara
| Storm News and Chasing [Index][Archives] |
Severe Storm Chase in Southeast Queensland: Monday 26th December 2005 Report compiled by Michael Bath and Jimmy Deguara |
James Chambers also has a storm chase report for this event.
A trough had passed through NE NSW overnight and was expected to trigger off storms in Southeast Queensland. The cap was very strong and there was also concern about the lower levels drying out east of the Divide. However, if storms fired there was good potential for severe weather.
Jimmy was up from Sydney on a few days chase and had stayed at my place following the Christmas Day supercell. We headed north into SE Queensland via the Lions Road north of Wiangaree. There was evidence of large hail and severe winds from the amount of leaves and branches stripped from trees close to the Queensland border.
We got an early lunch at Boonah before waiting at the Warril View lookout. Anthony Cornelius joined us on chase after we let him know we were in the area. Paul Miracki also turned up at the same spot. It was very hot and there were no signs of storms developing at this stage.
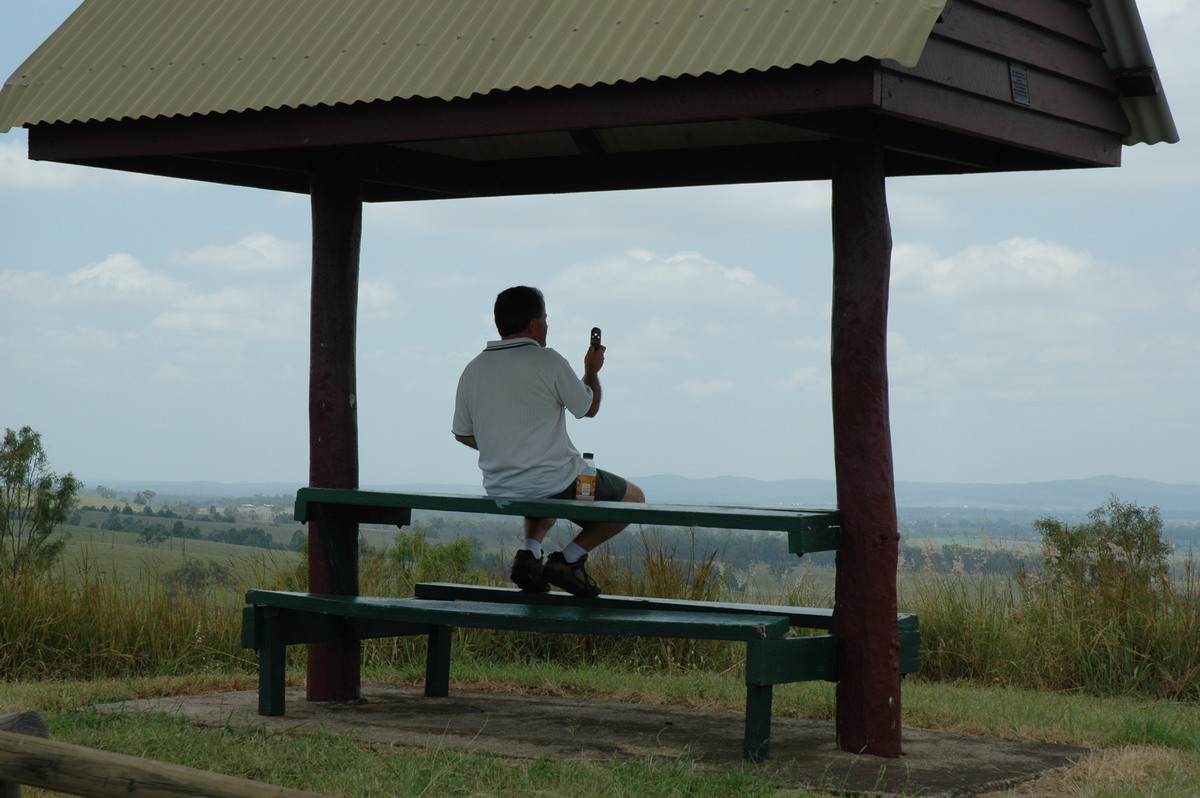
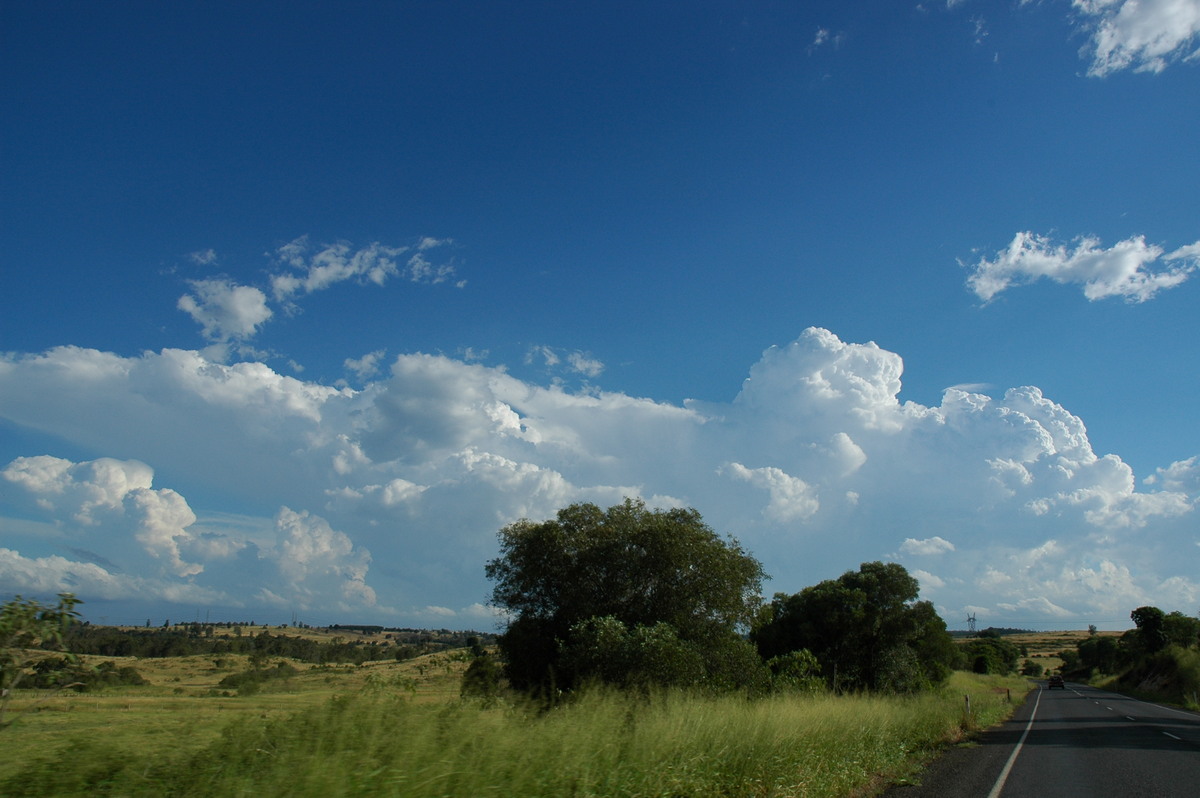
Congesting cumulus was forming on the ranges but not taking off. We obtained the latest streamline charts and decided to move further north, though the target now seemed to be much further north than originally forecast: 50ks northwest of Esk.
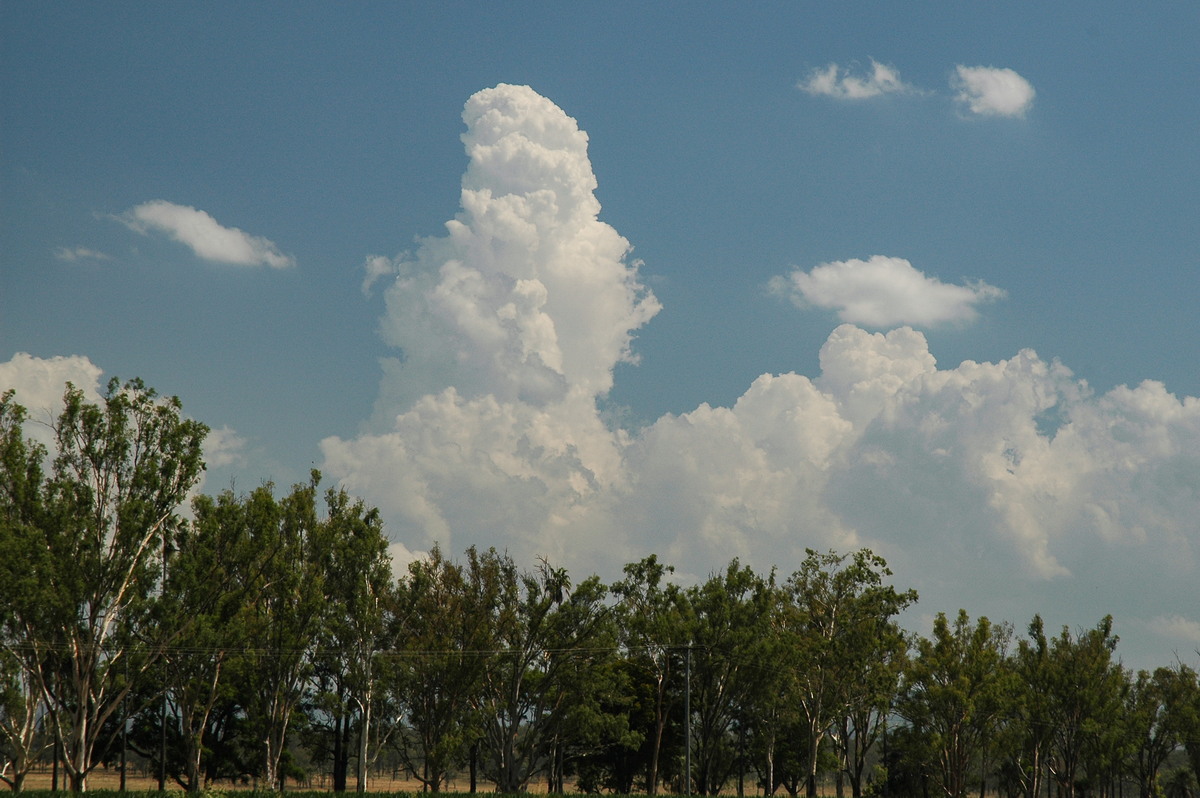
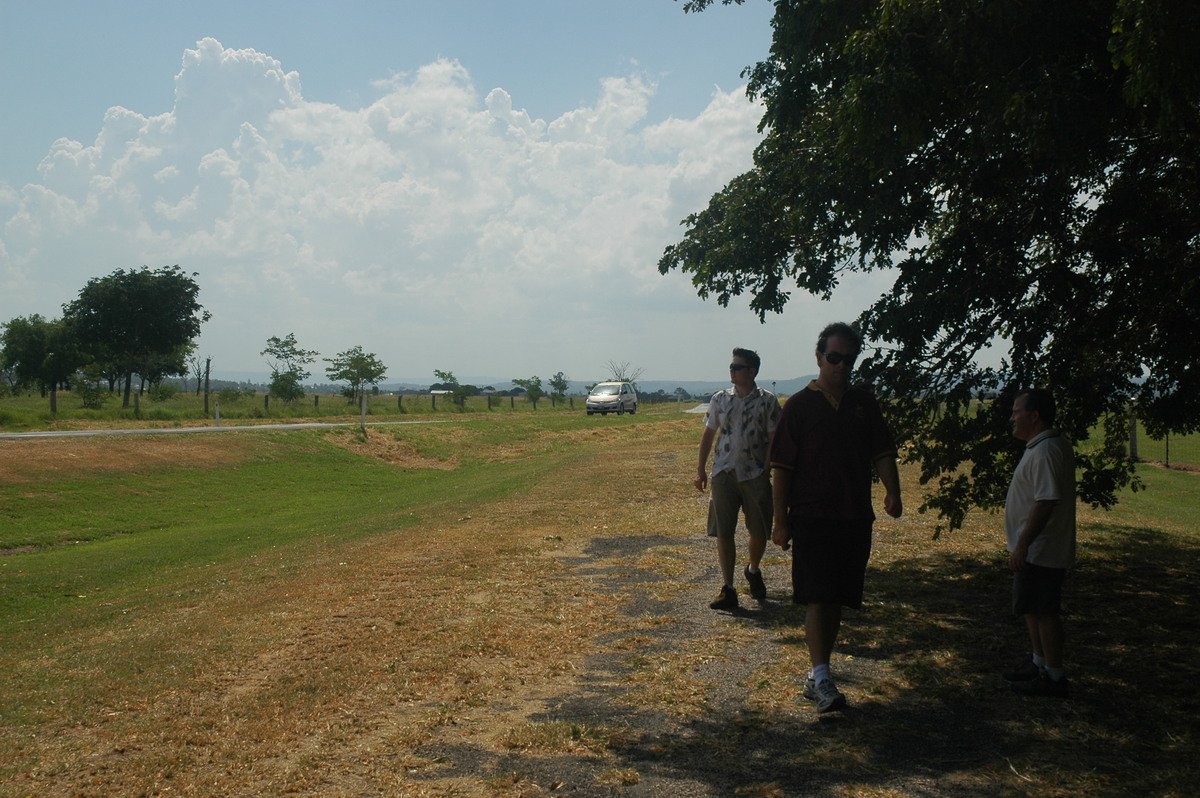
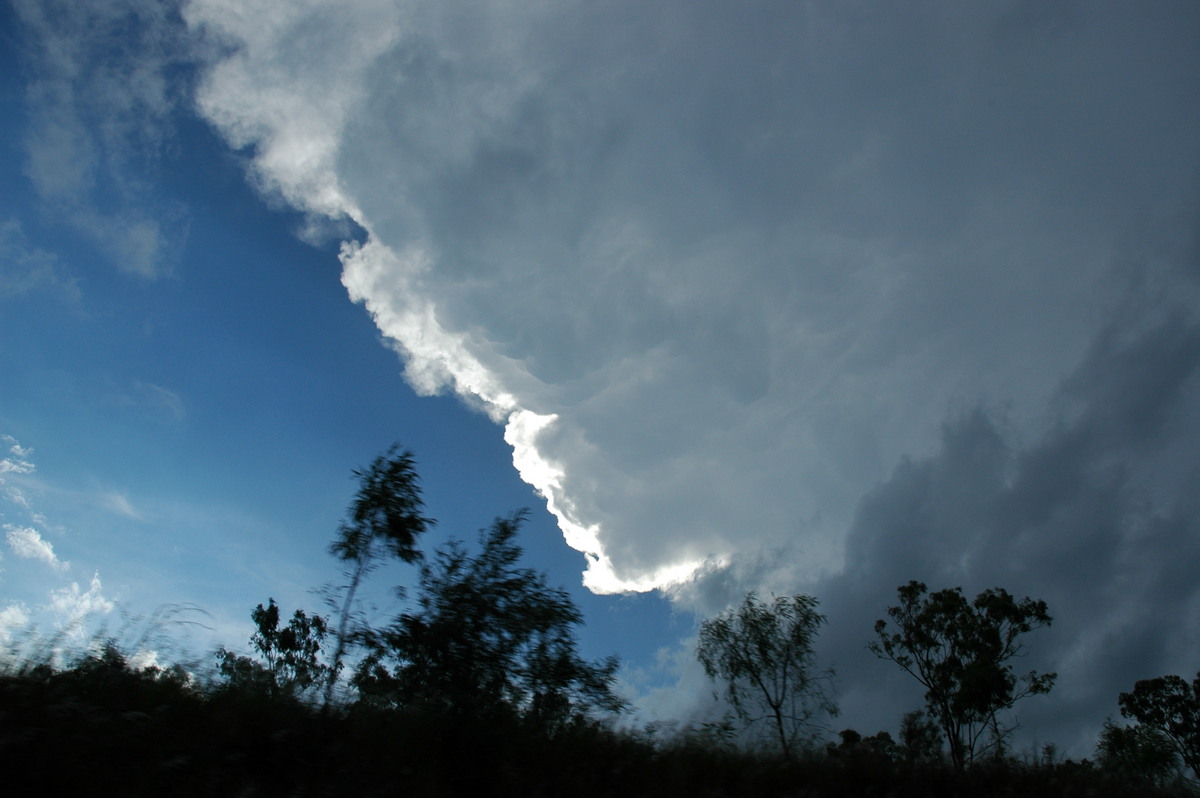
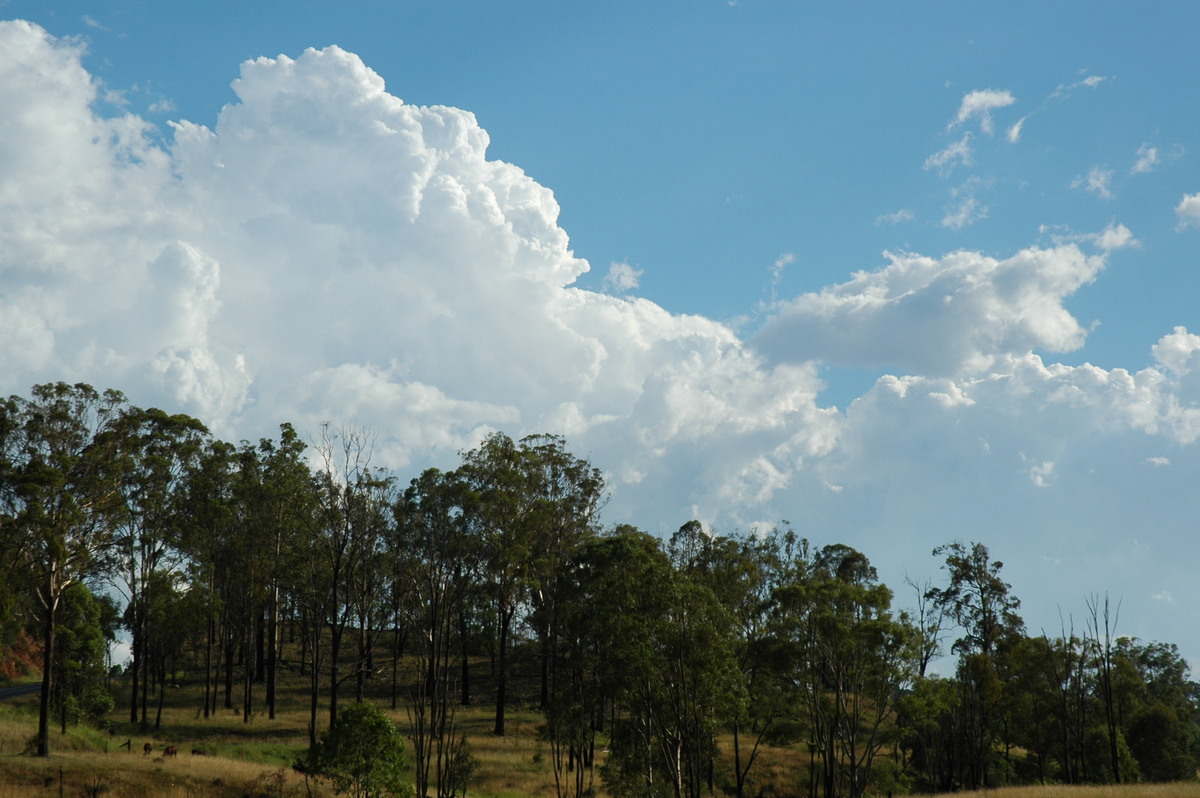
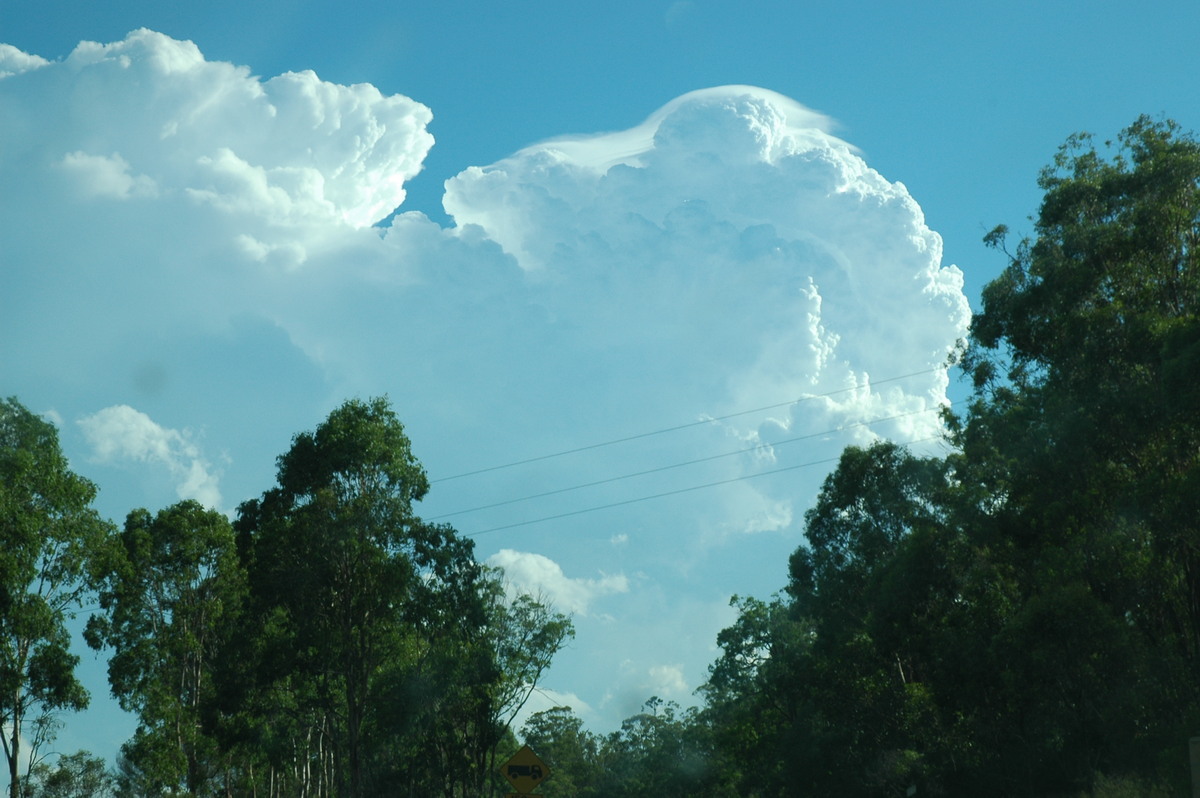
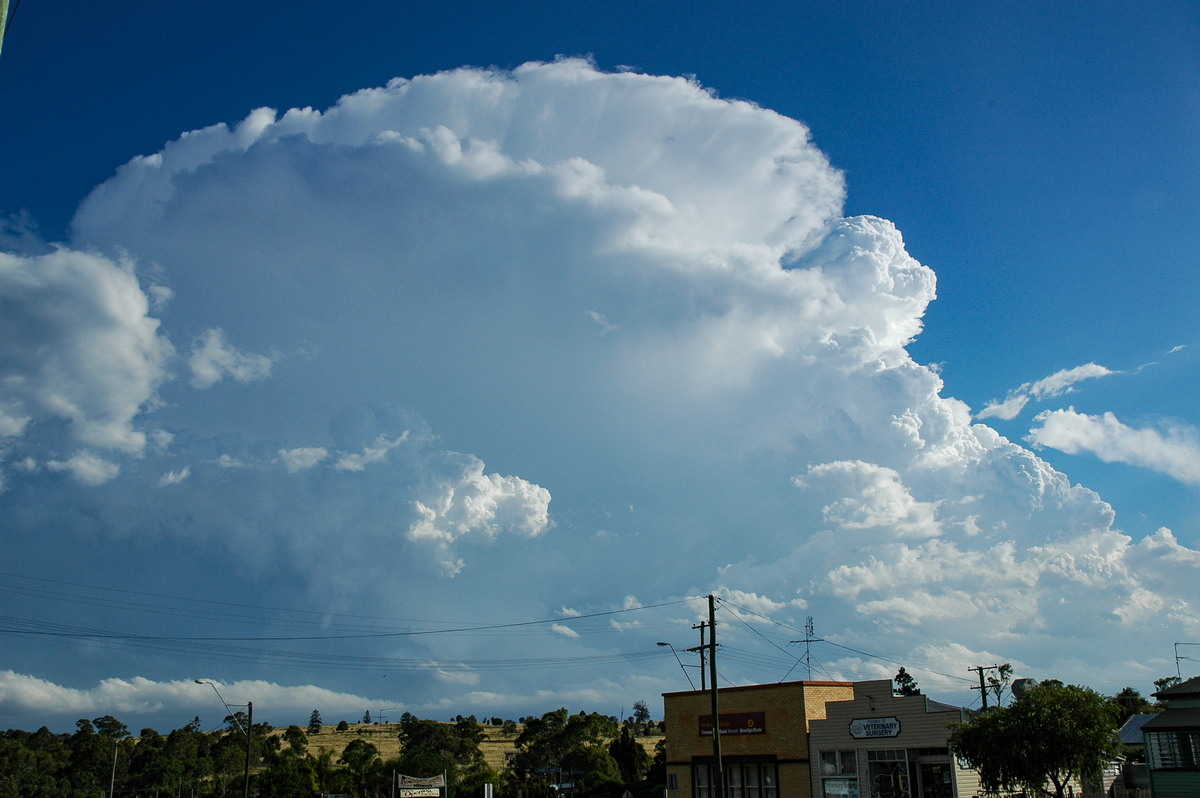
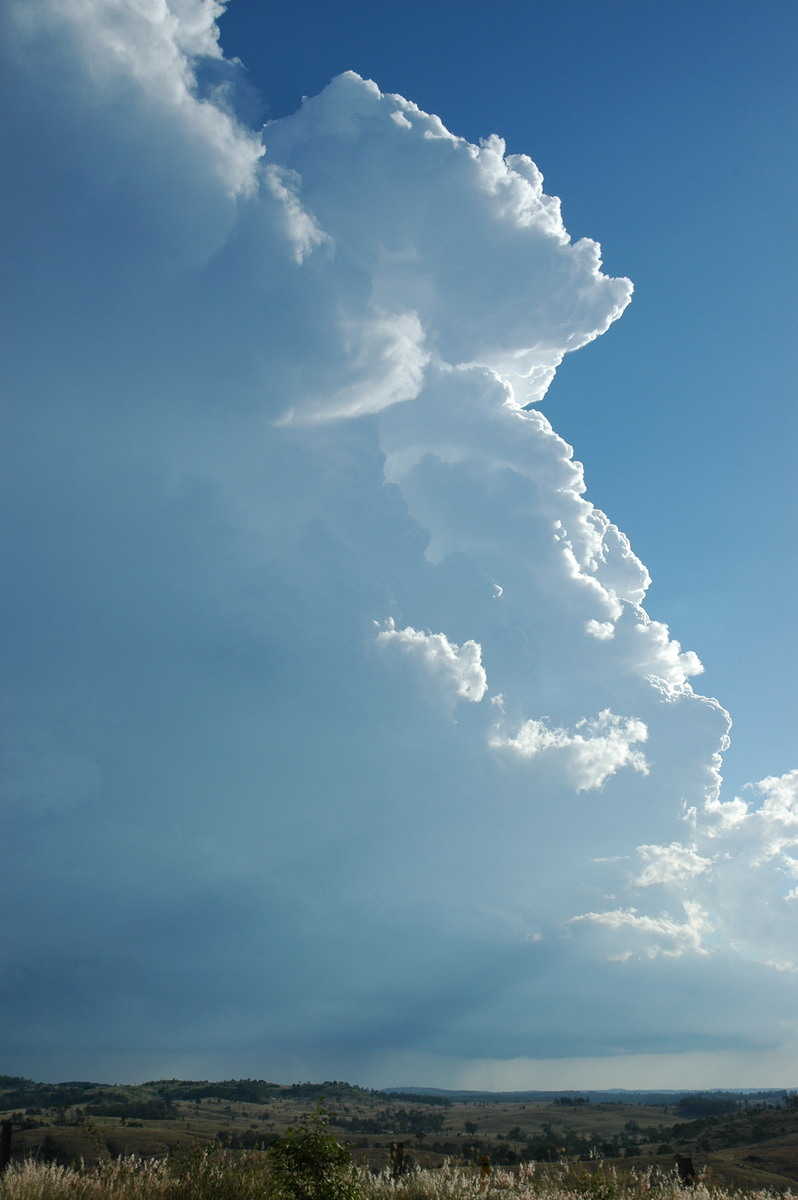
At 2.30pm (QLD time) a thunderstorm finally broke through the cap near Yarraman. The storm did not look very high topped at first but fresh updrafts were pileus topped. Another cell tried to get going to our west over Toowoomba but it just wouldn't.
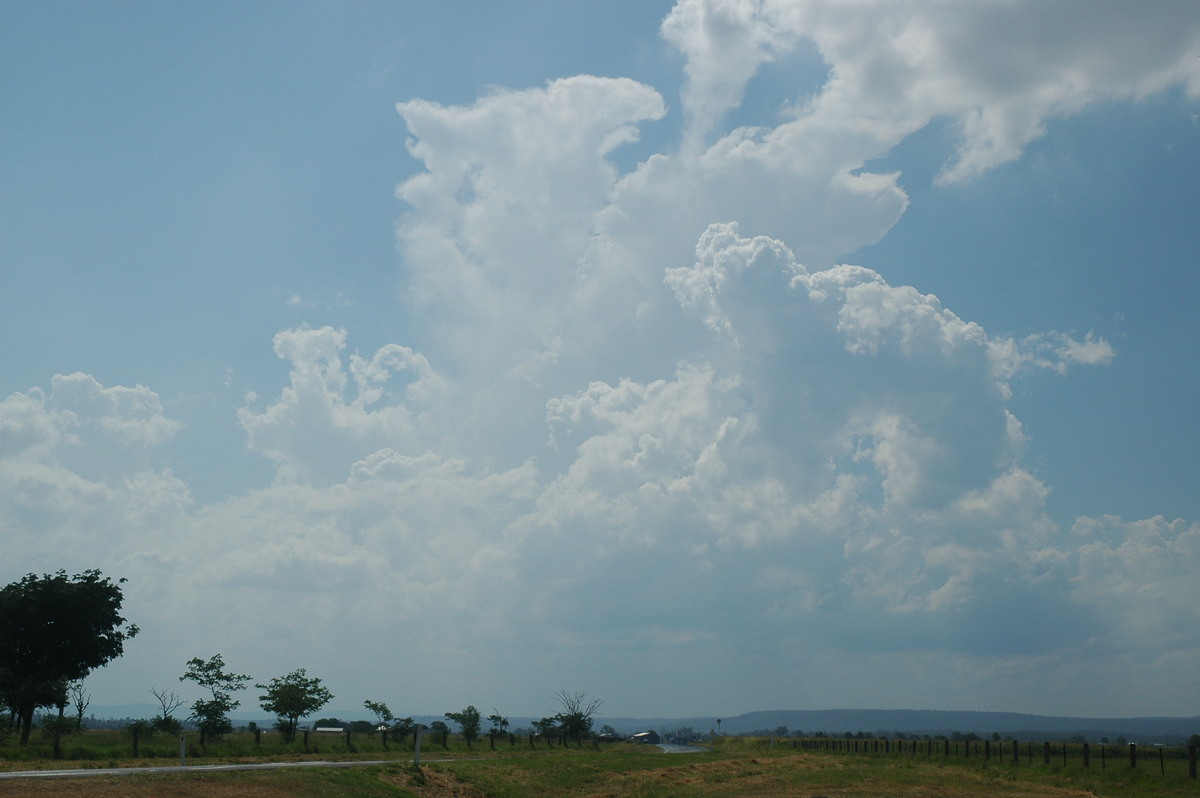
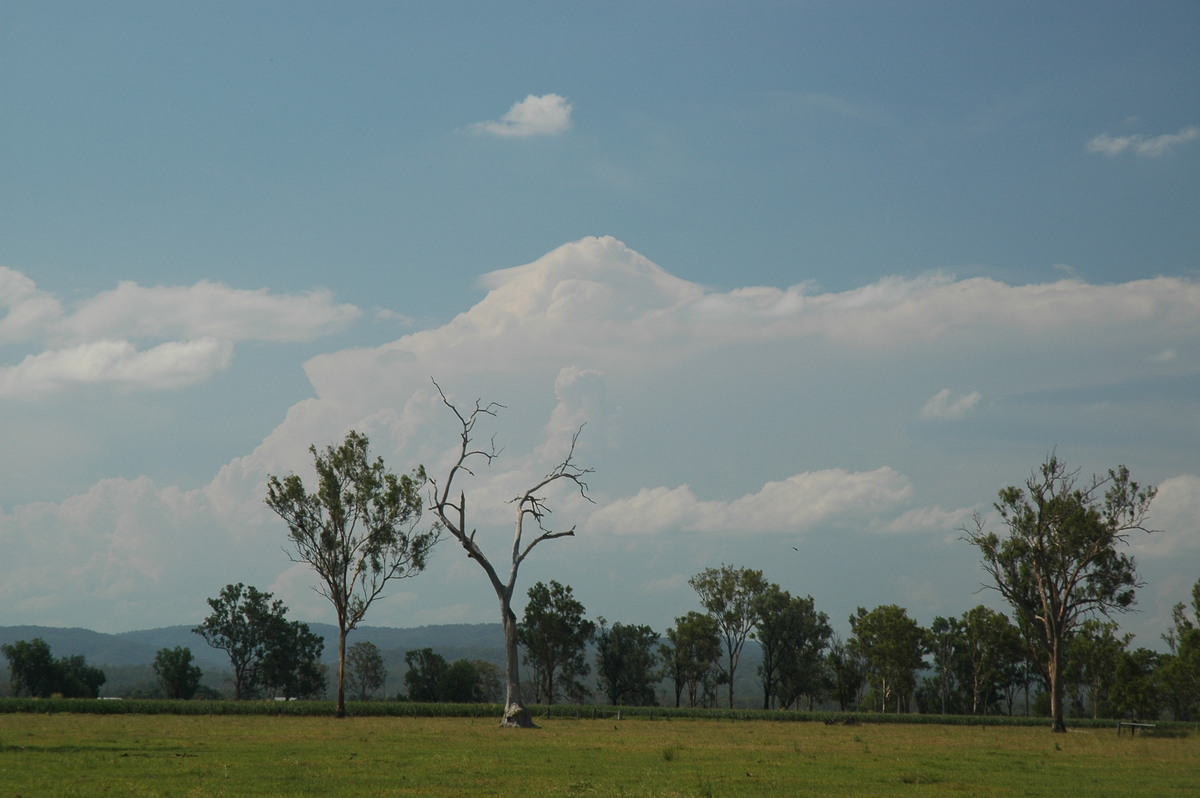
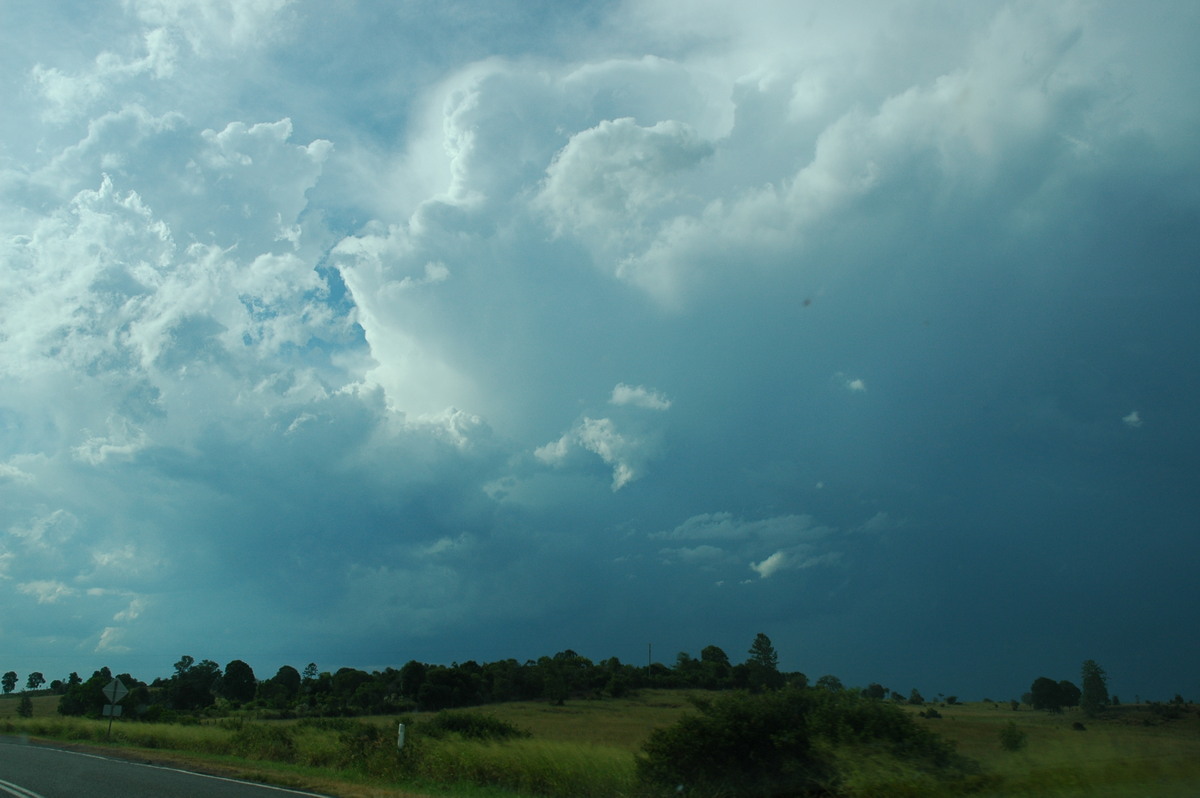
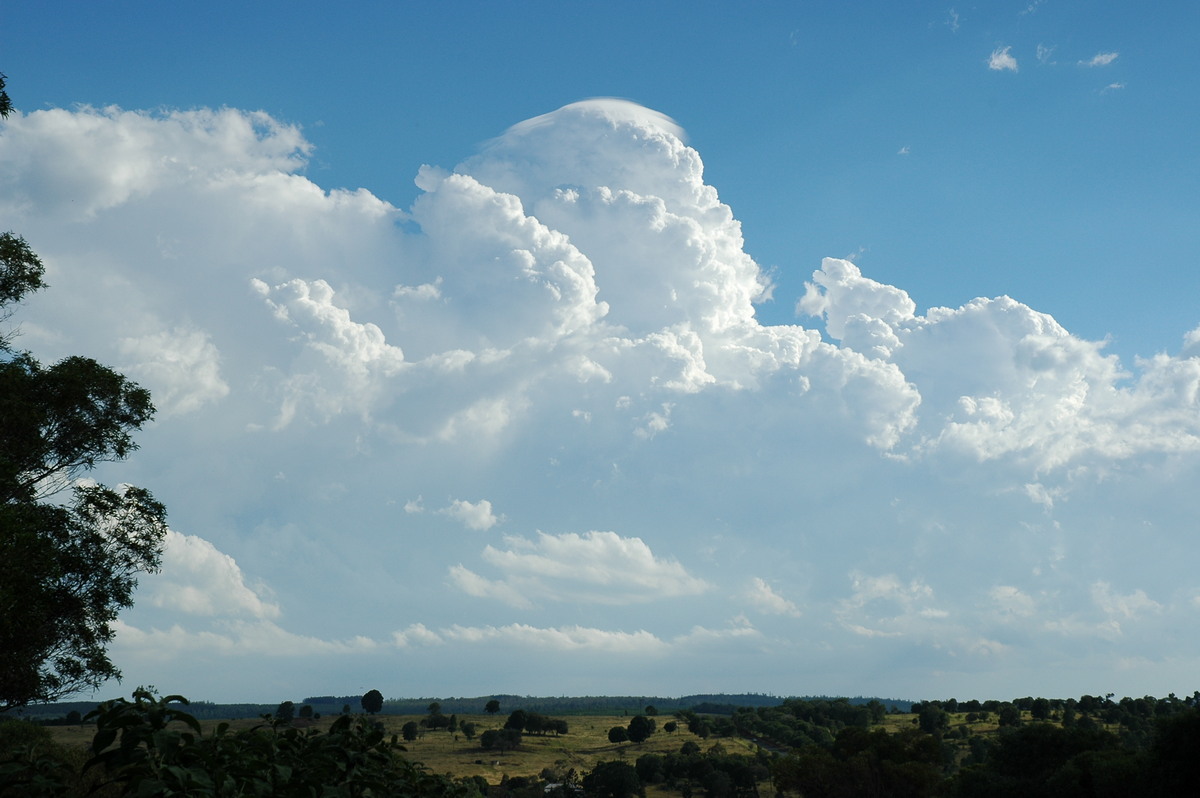
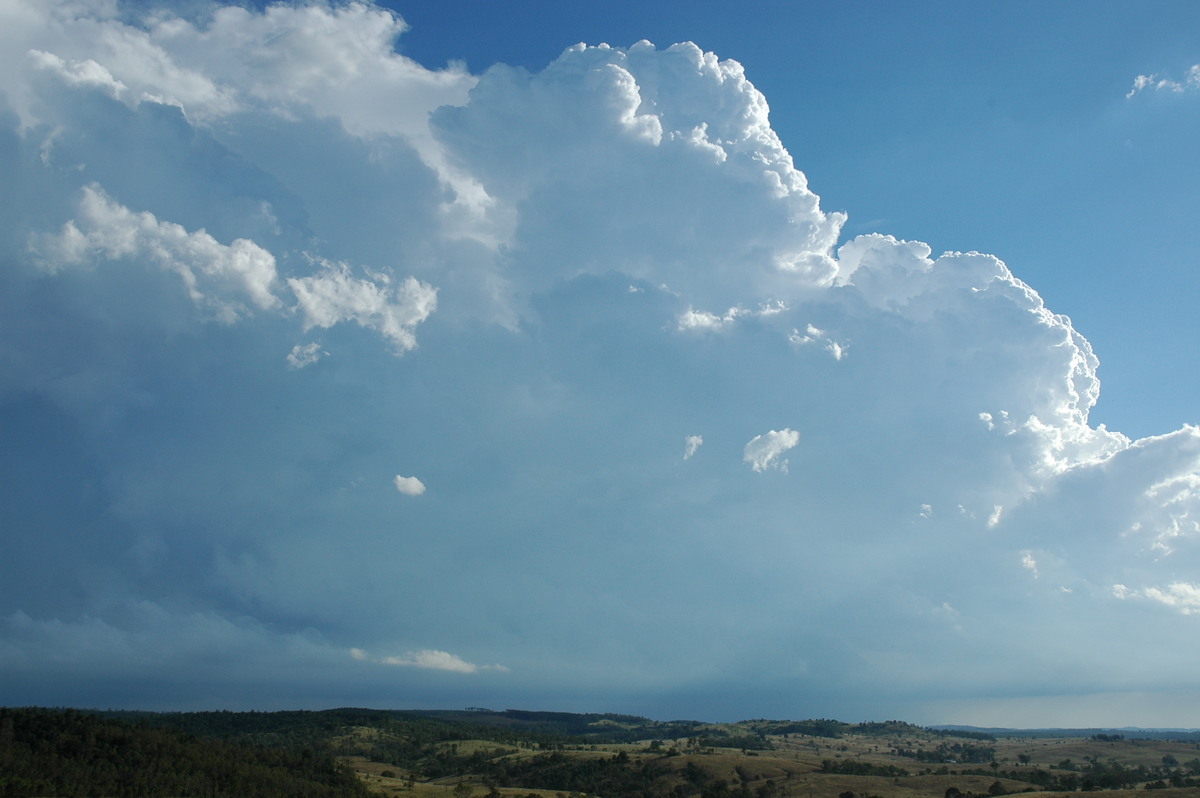
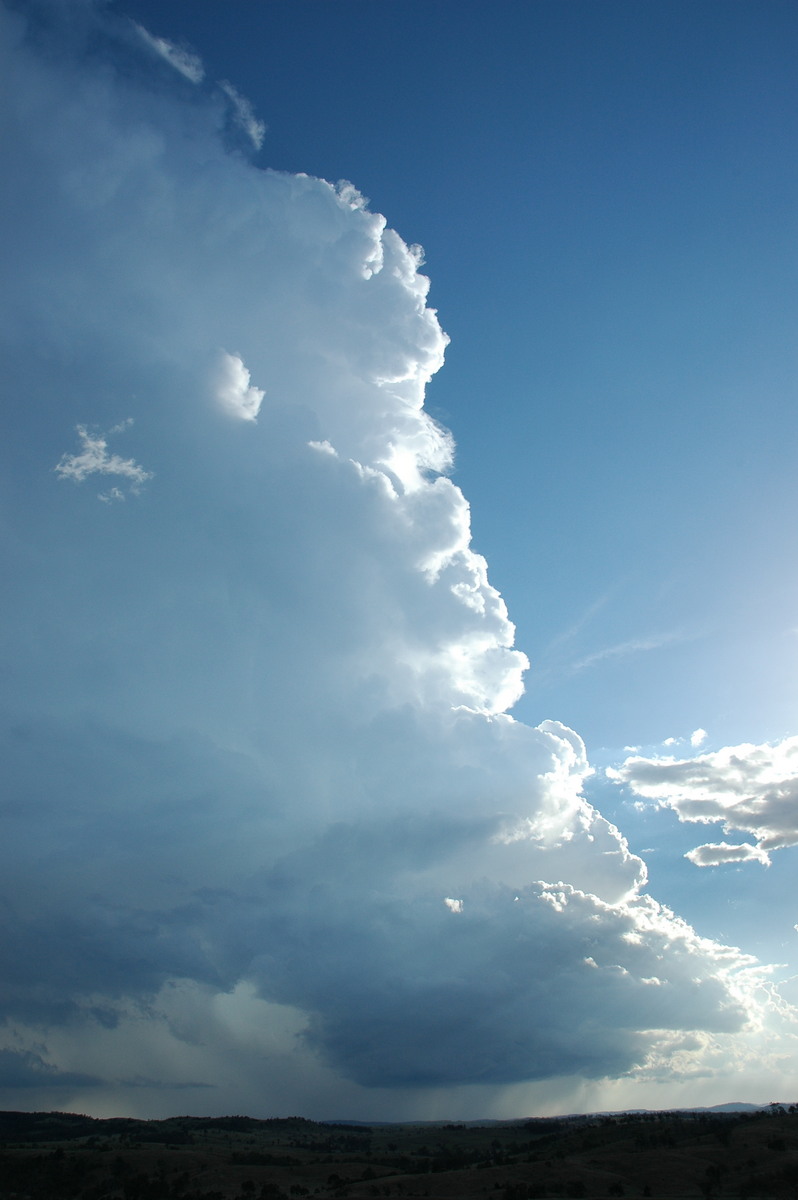
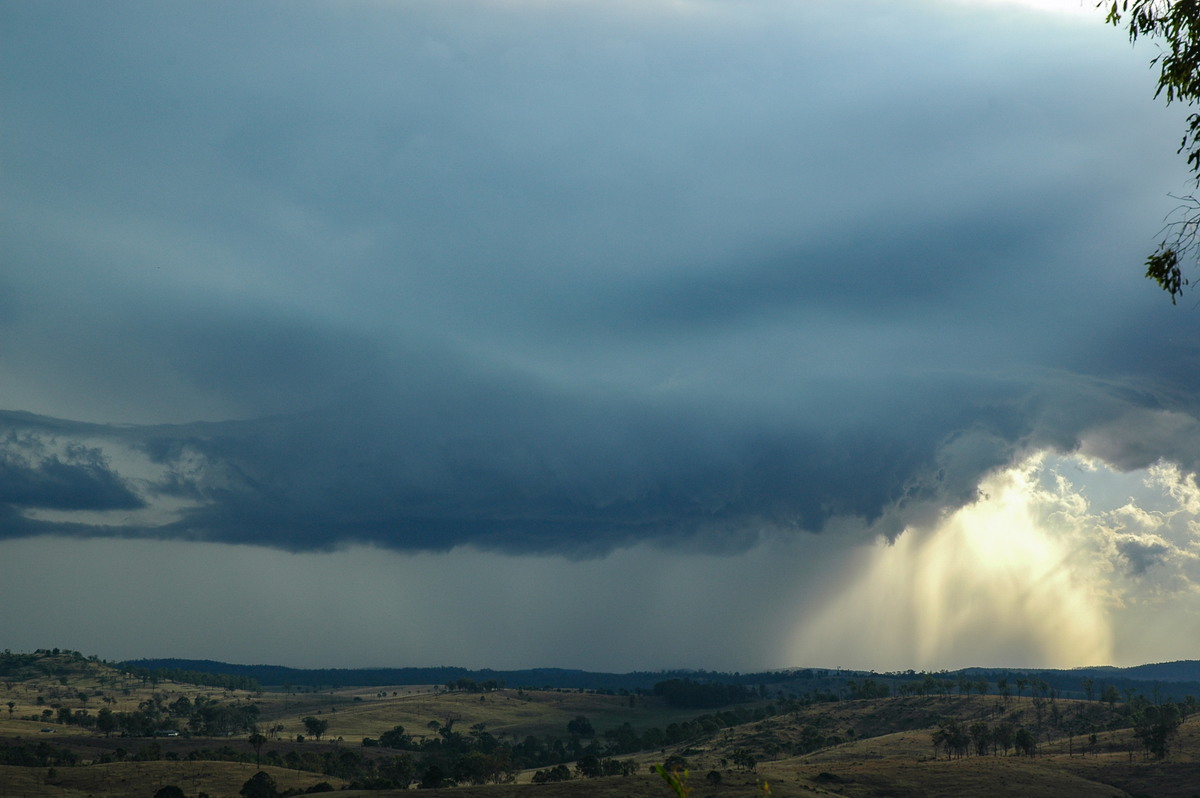
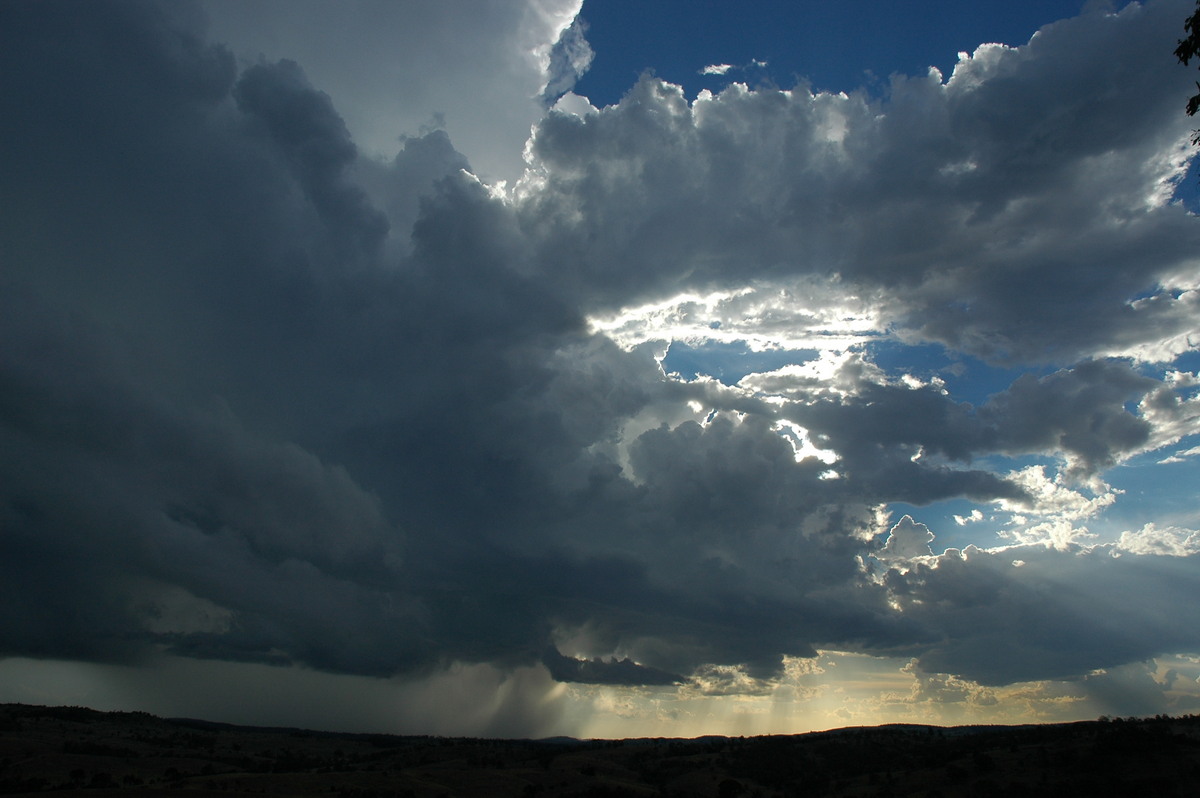
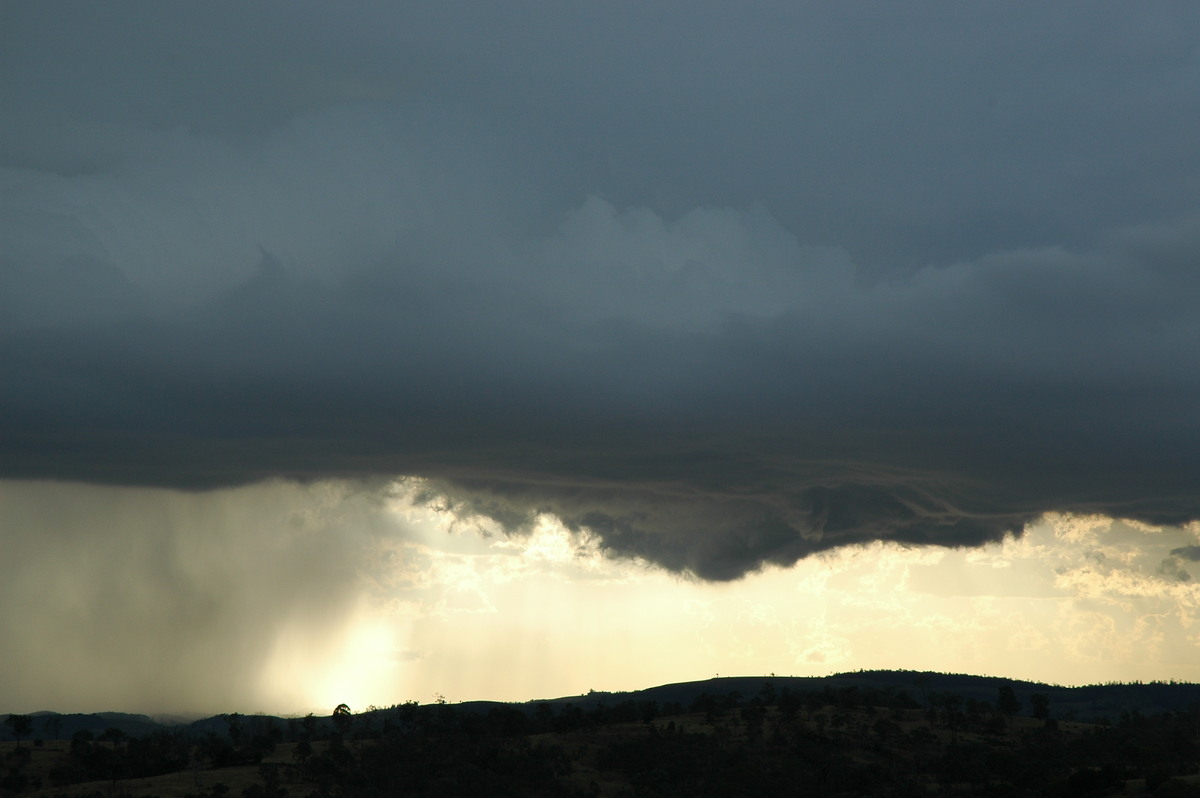
The call was made to head north to the only storm activity within reach. The structure grew quite impressive as we got closer: the storm was now very high topped and had a thick anvil spreading eastwards.
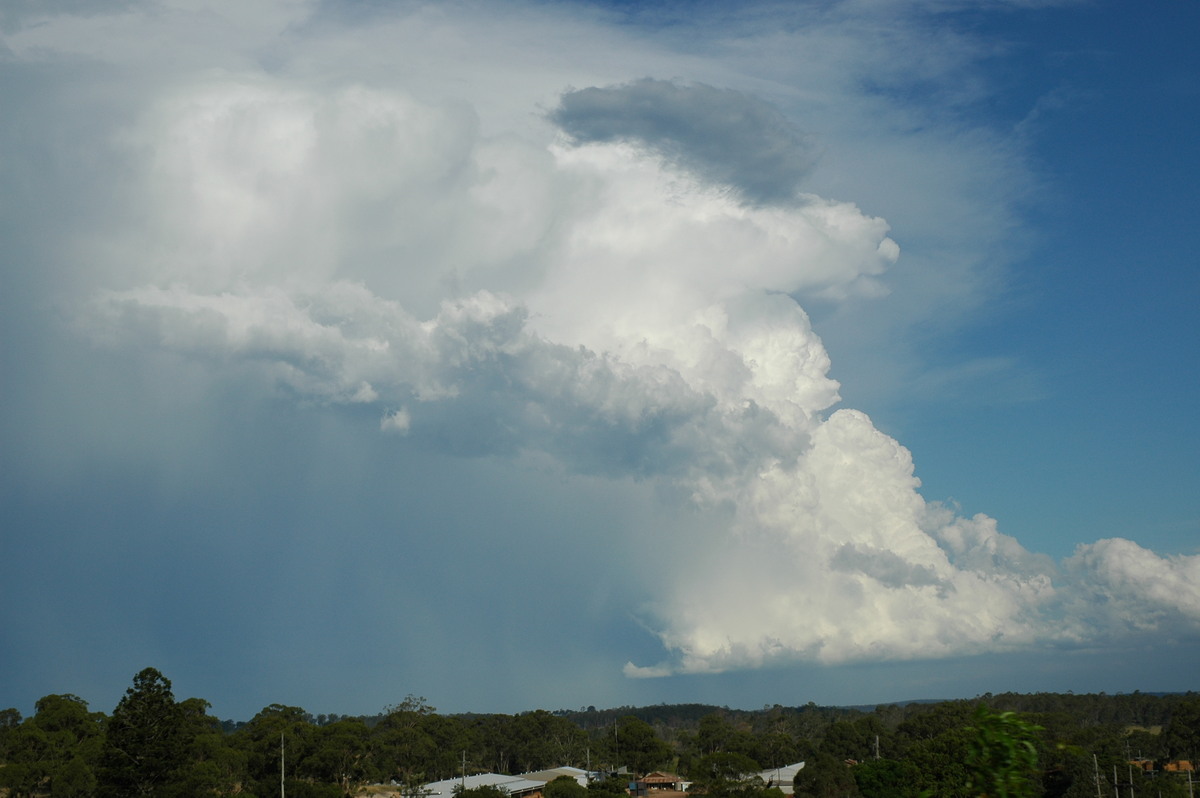
The road options are very limited north of Harlin, and forced us to head west then north instead of the ideal north for an intercept. We got close to the storm by 4pm but it appeared to have weakened. A later report from a friend at Nanango revealed the cell caused extensive damage to trees along the Tarong power station road, and produced jagged hail to 3cm diameter.
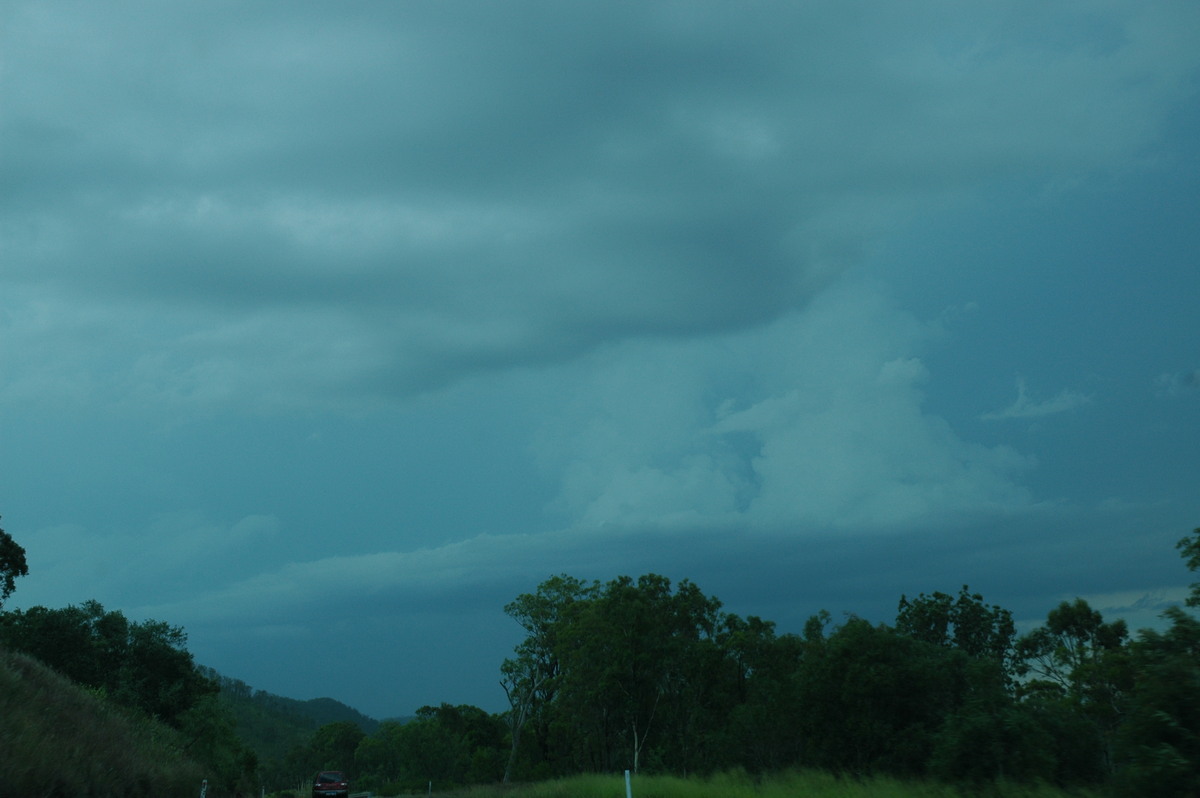
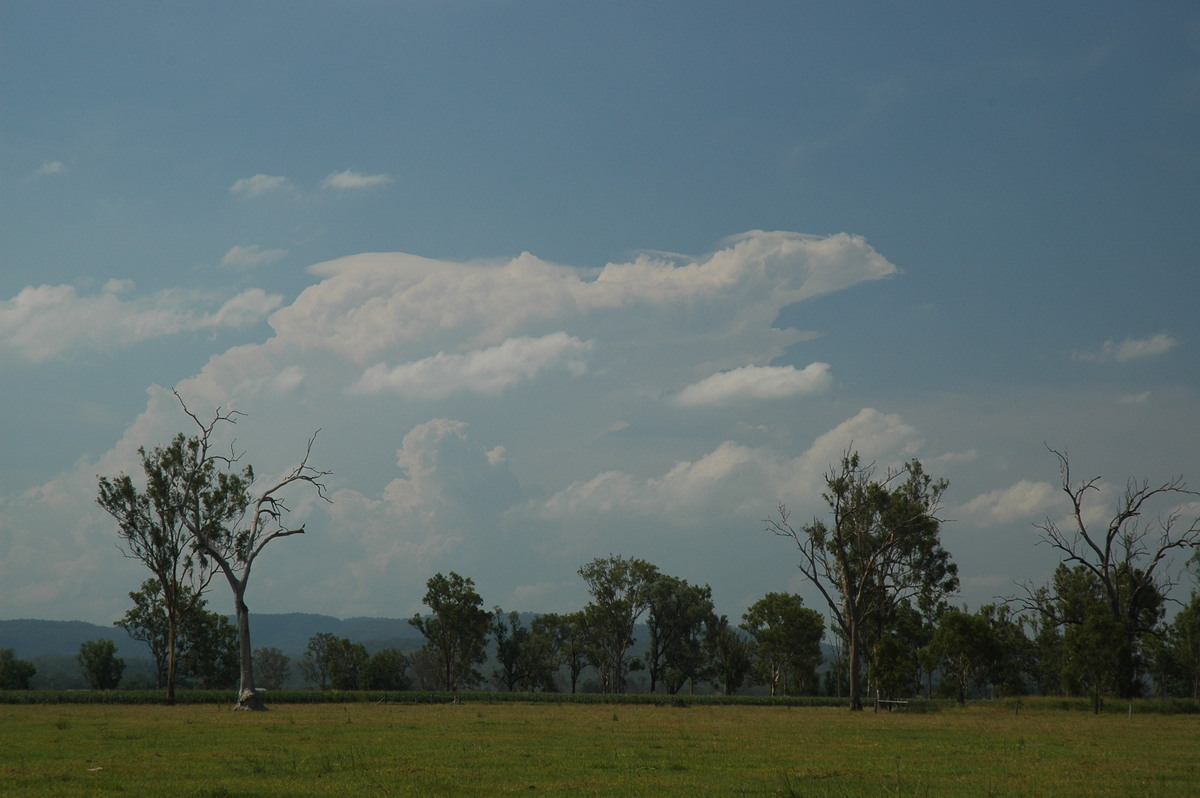
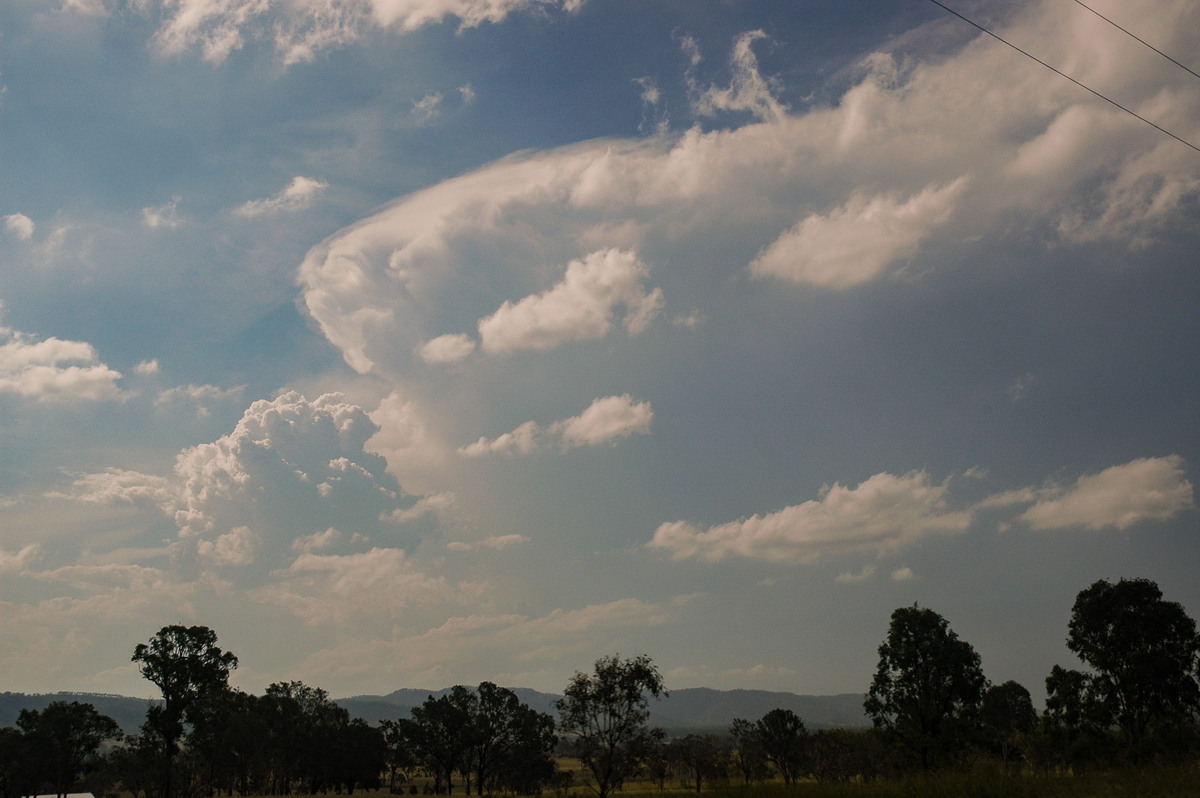
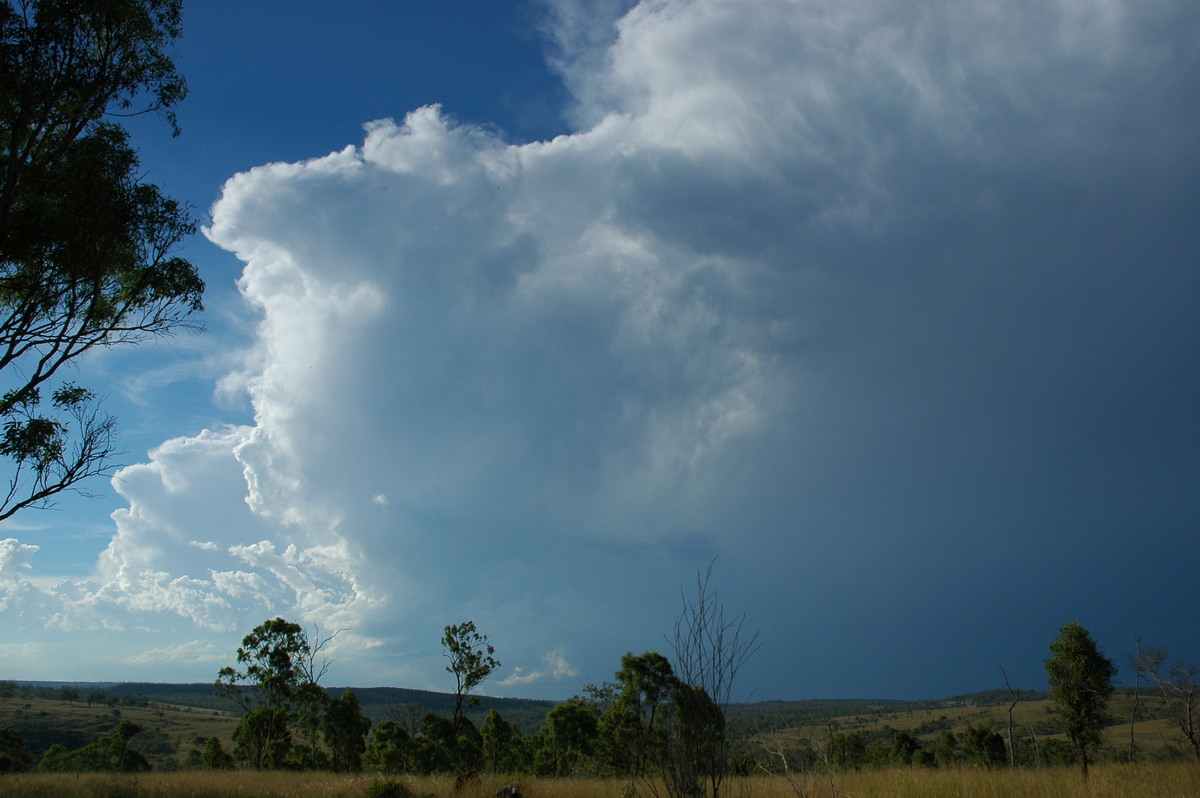
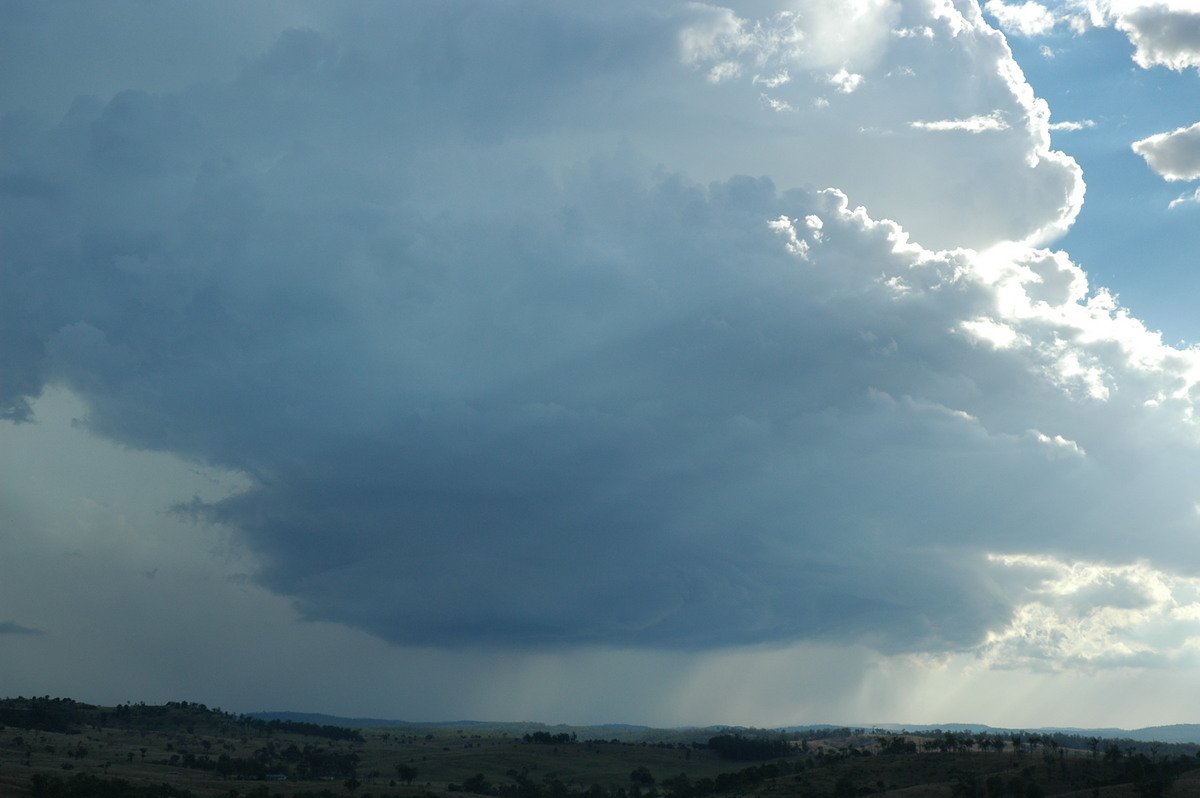
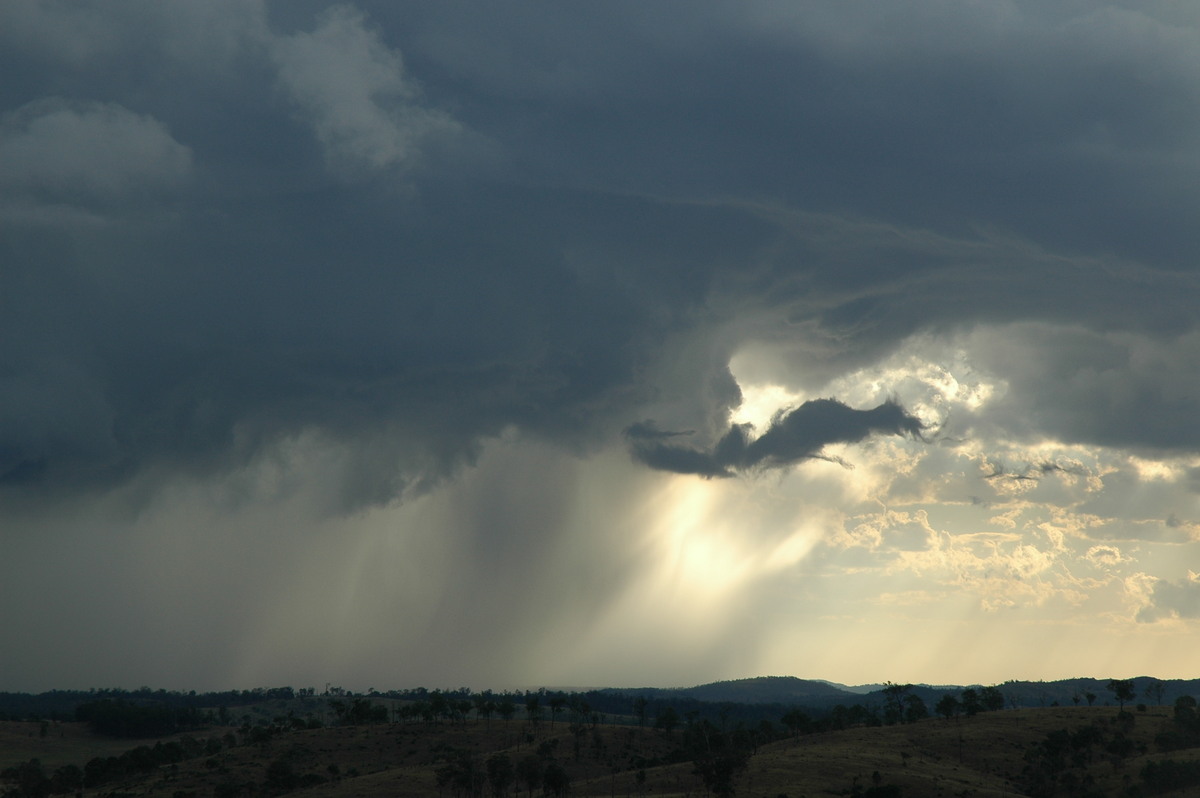
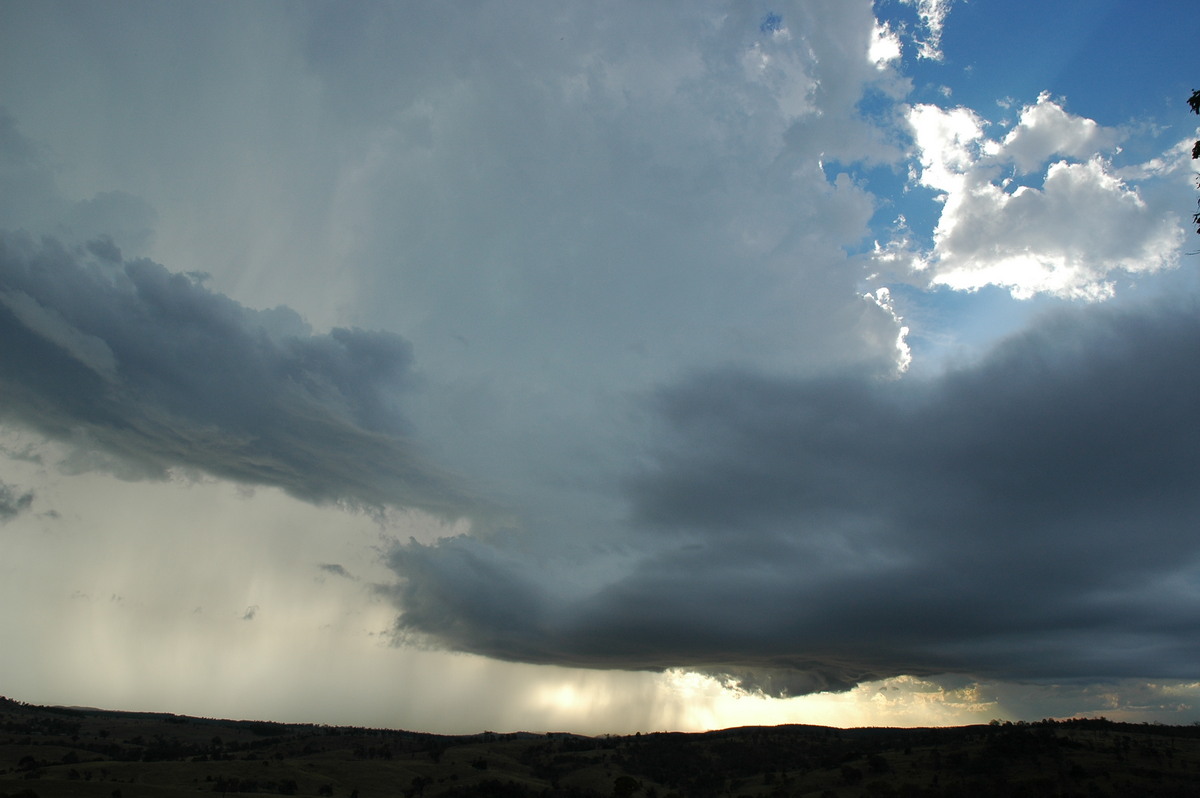
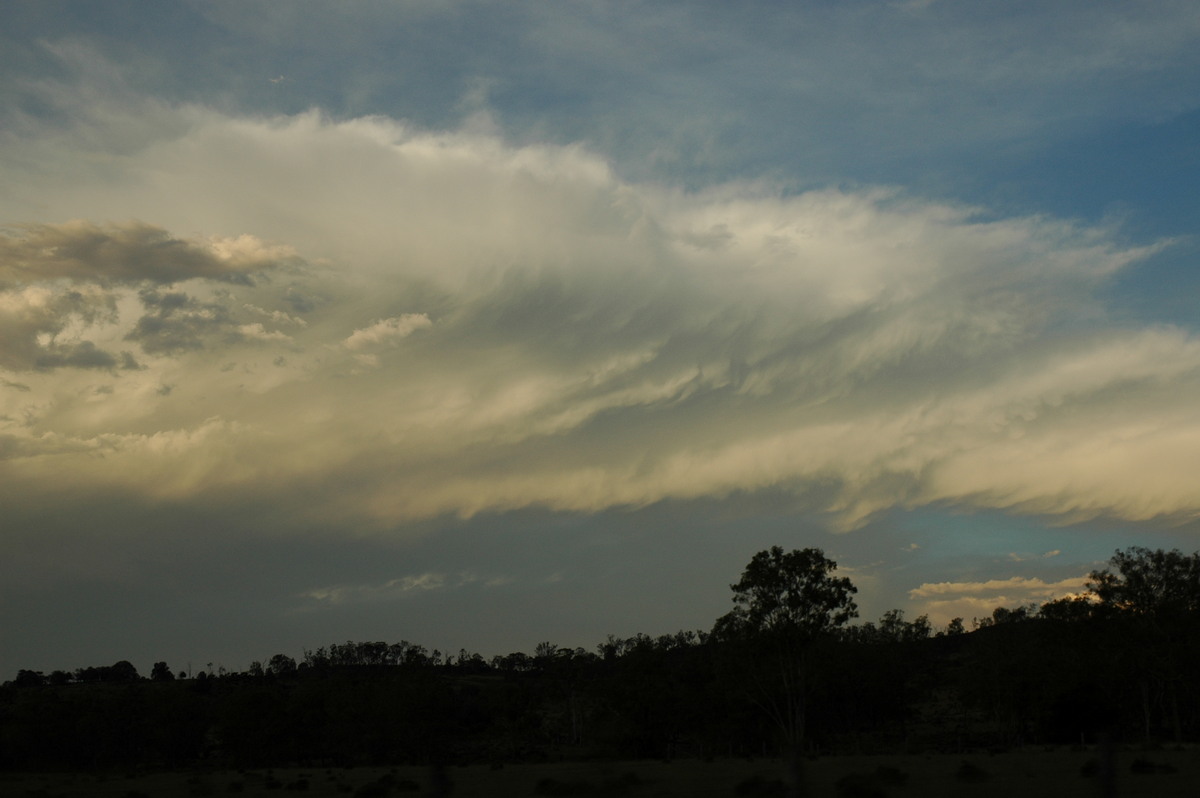
Another storm SE of the first exhibited some impressive structure.
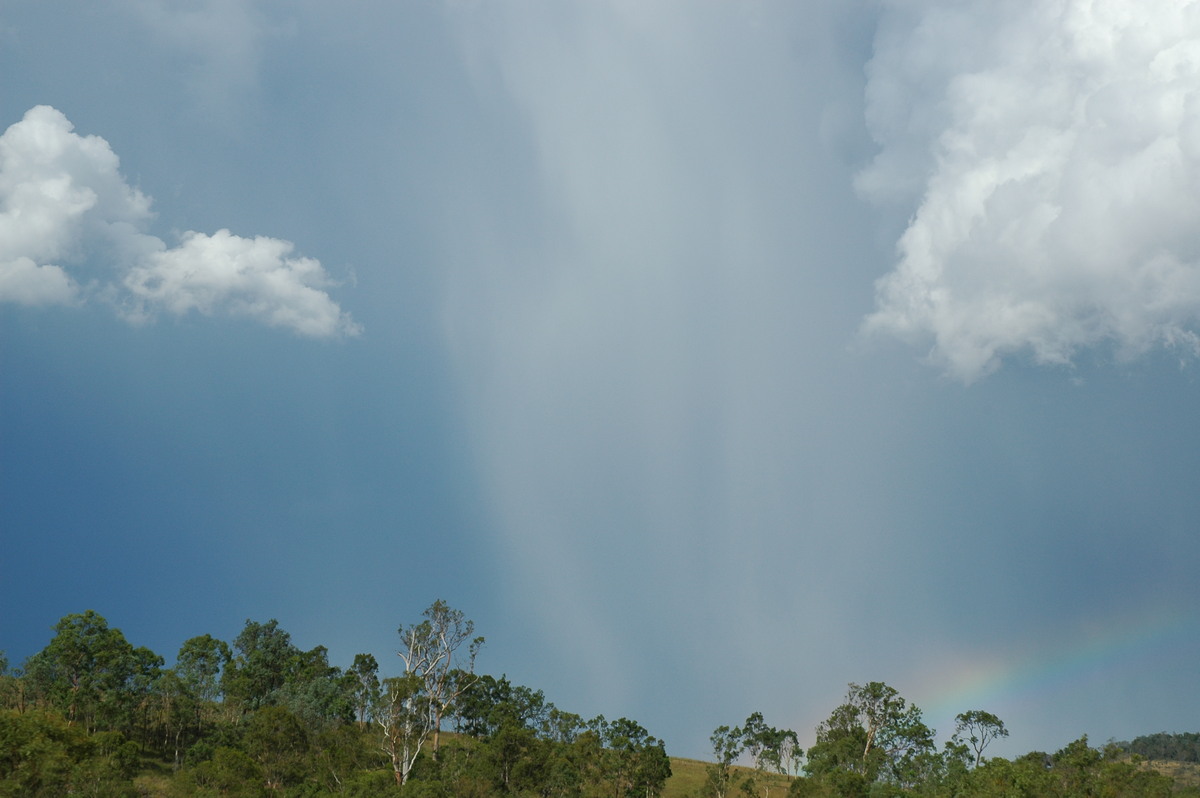

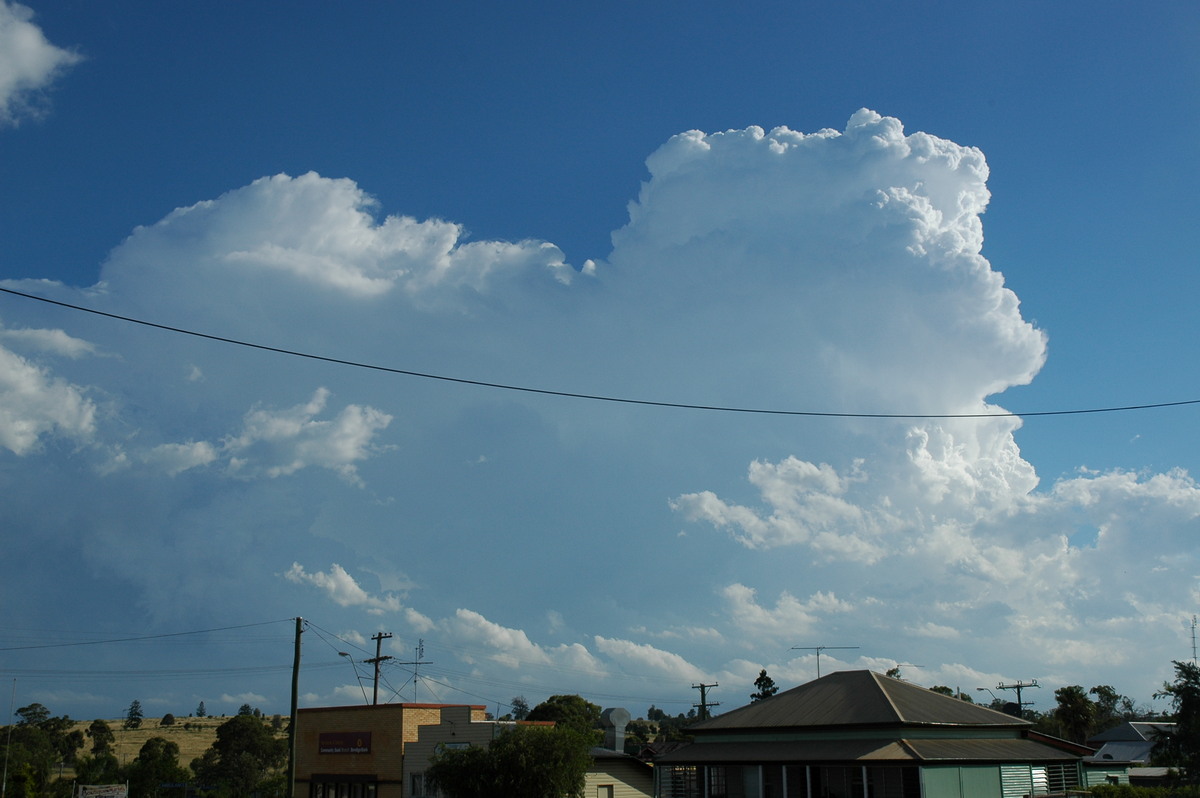
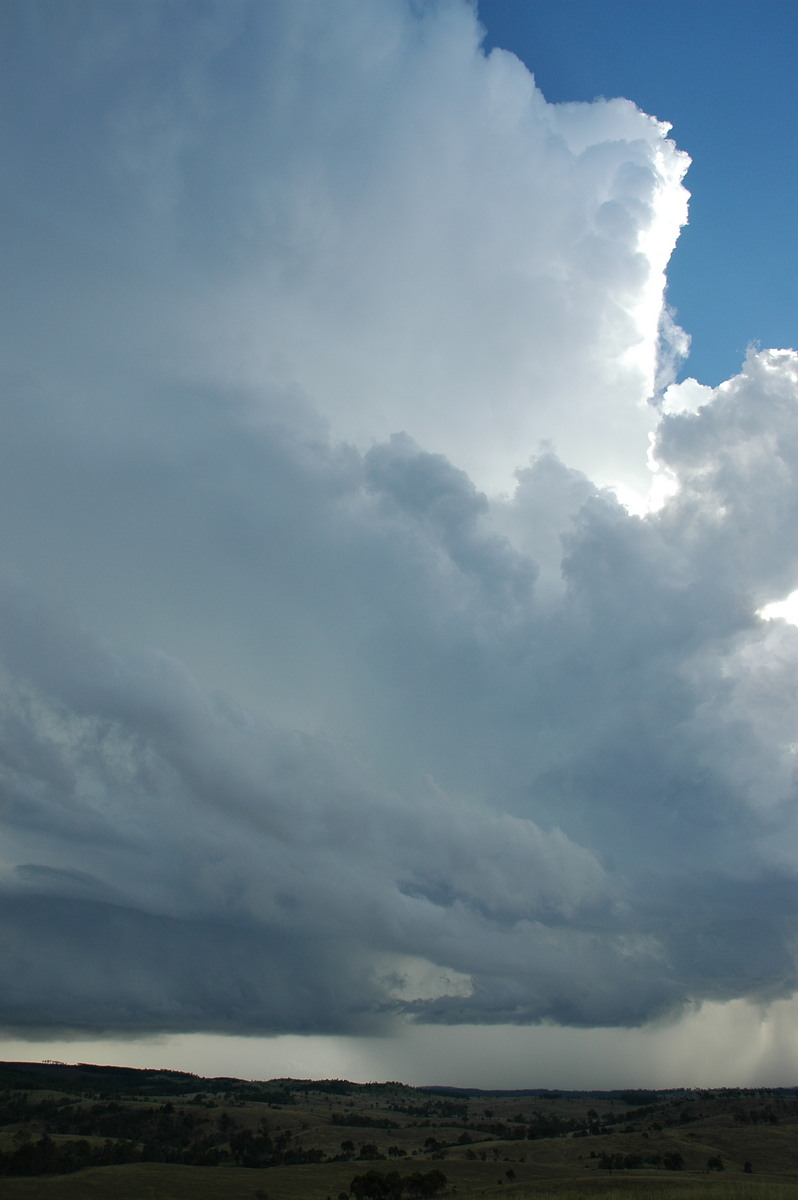
Fresh updrafts had now formed south of us and appeared chaseable.
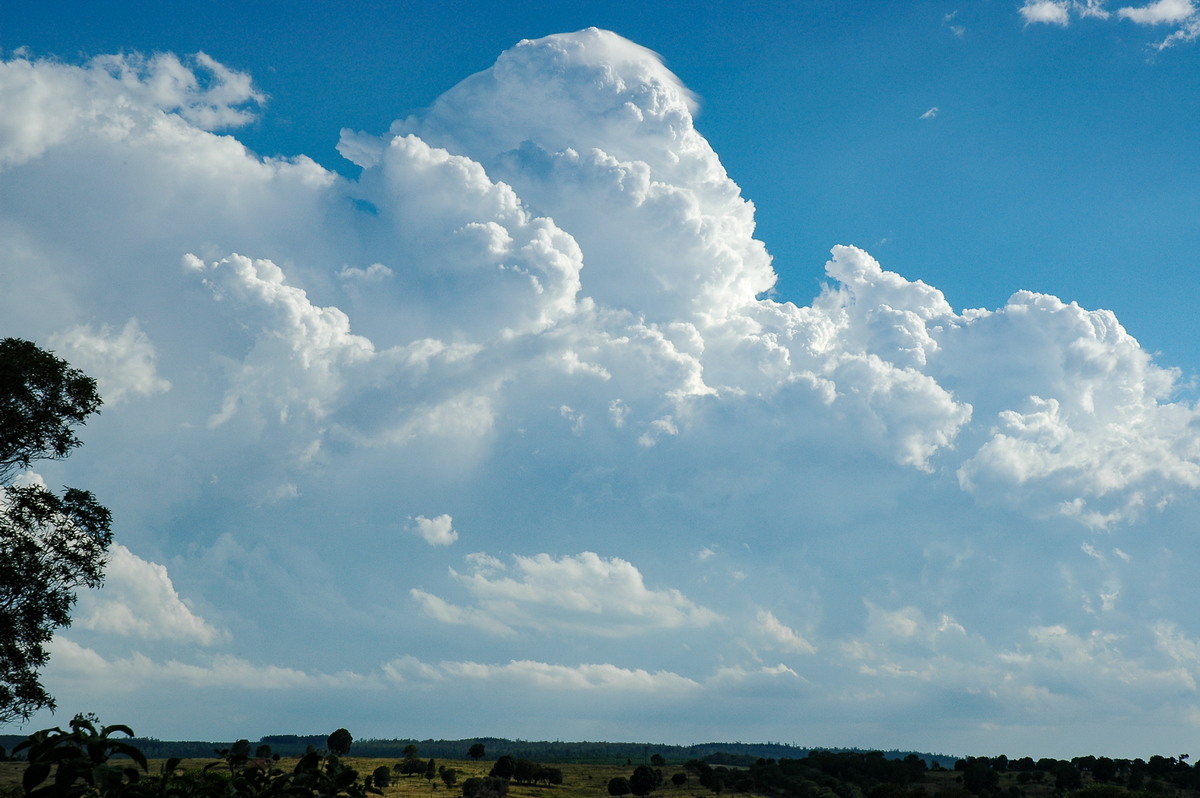
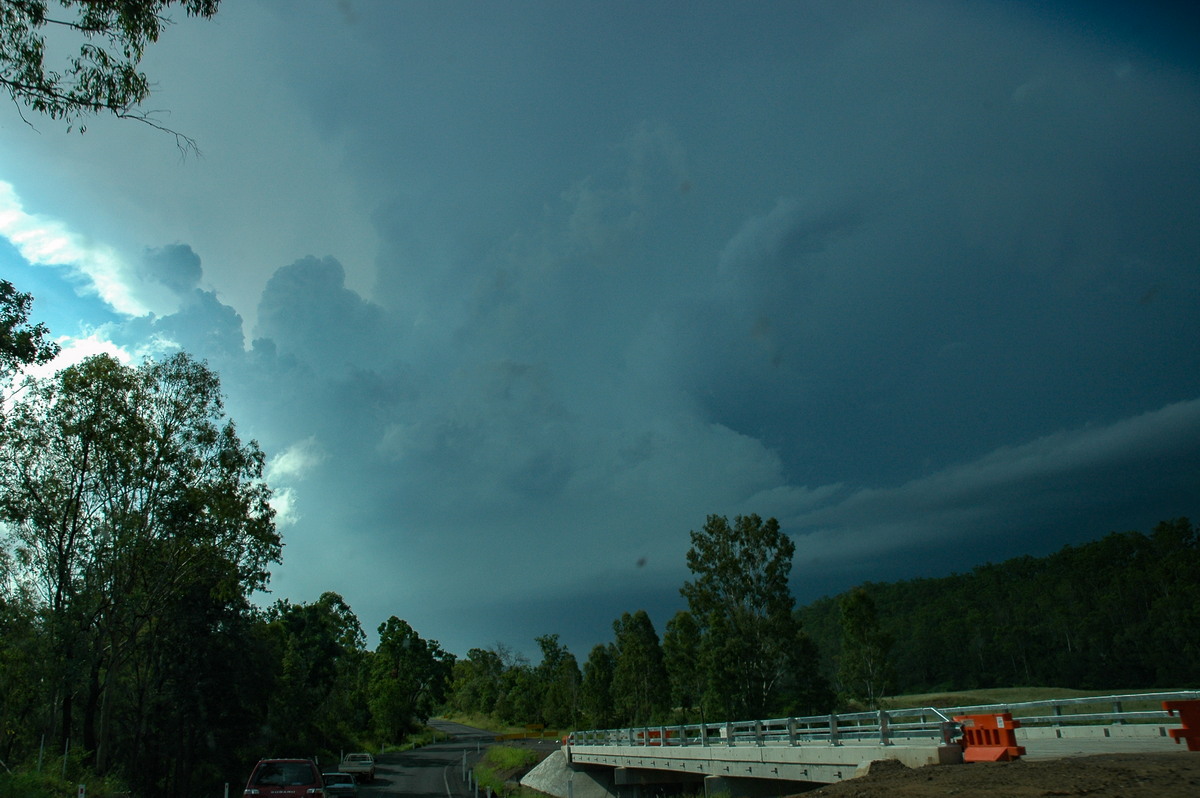
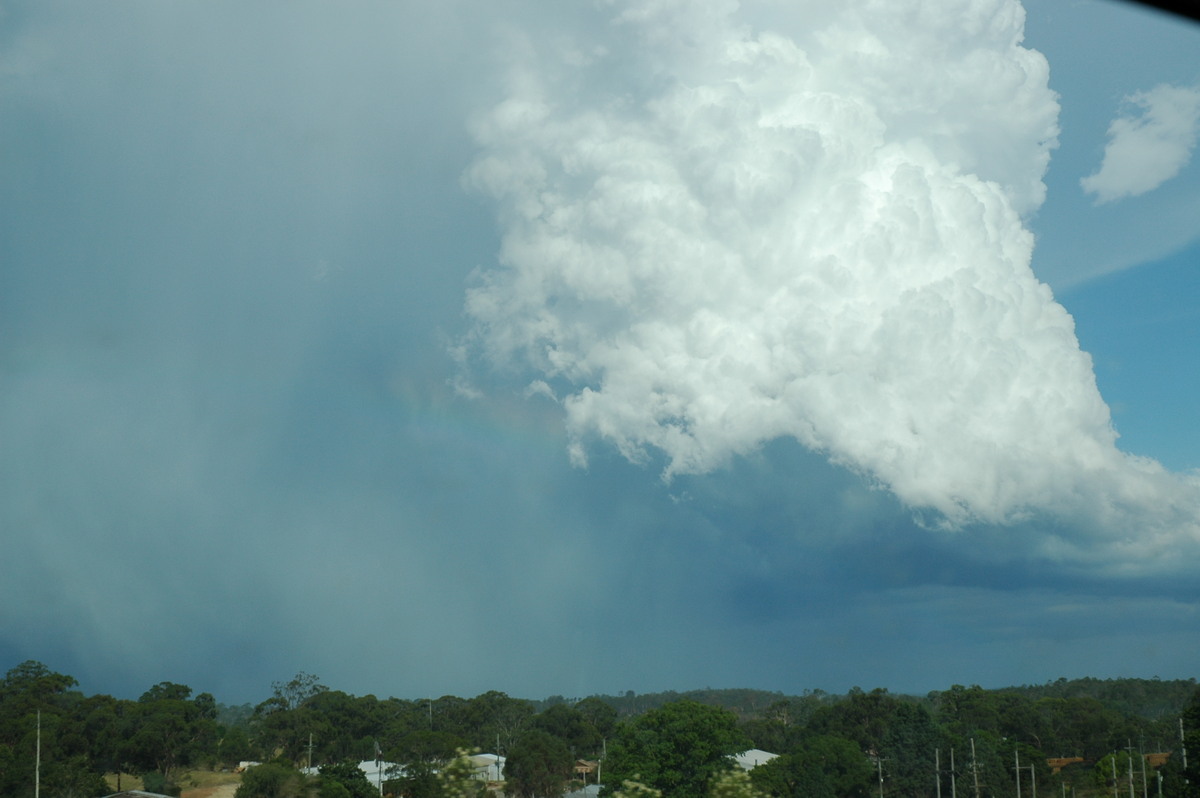
We headed back south to Yarraman which had been blacked out by the earlier storm. The updrafts on the new storm were explosive in structure.
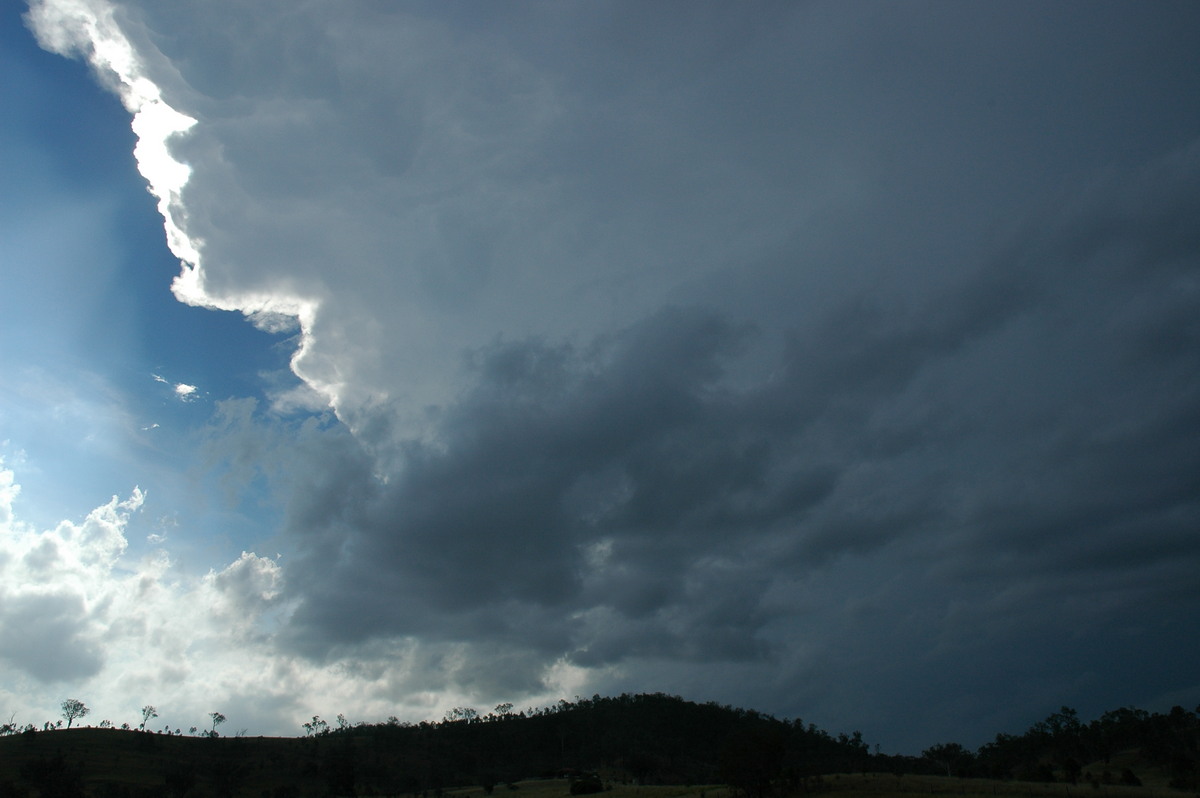
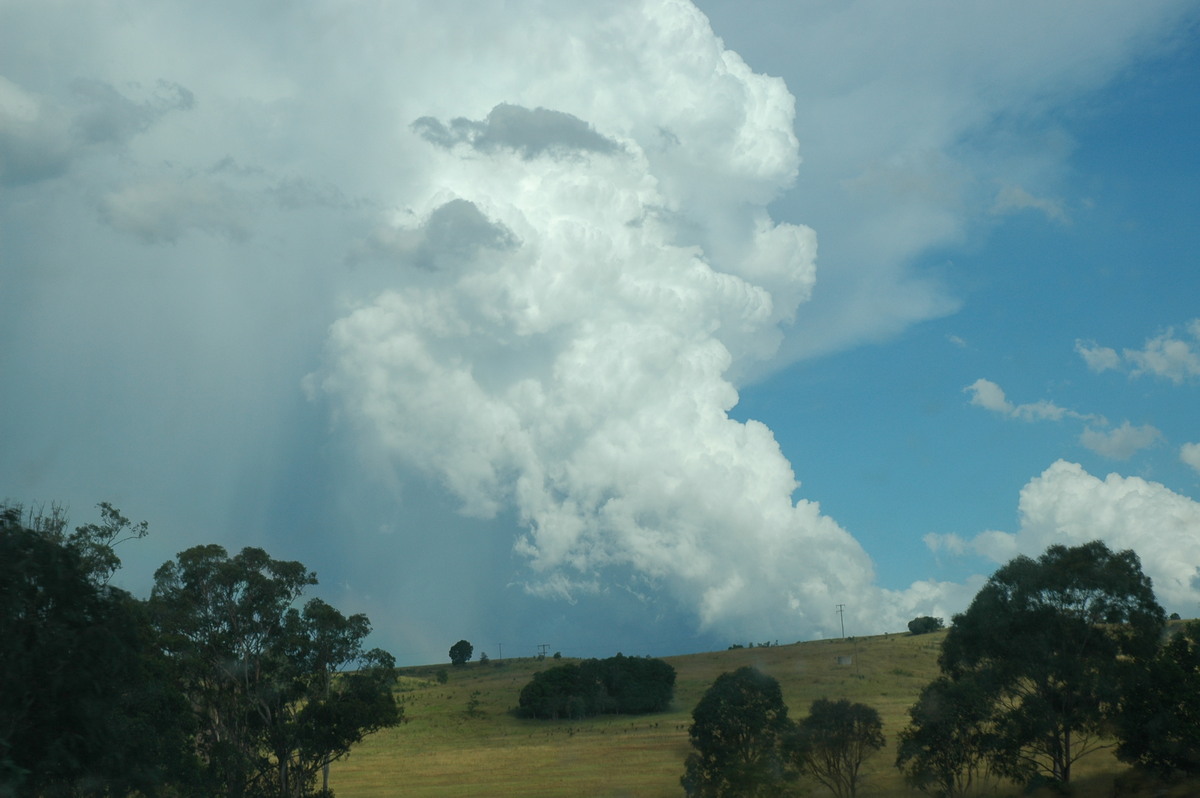
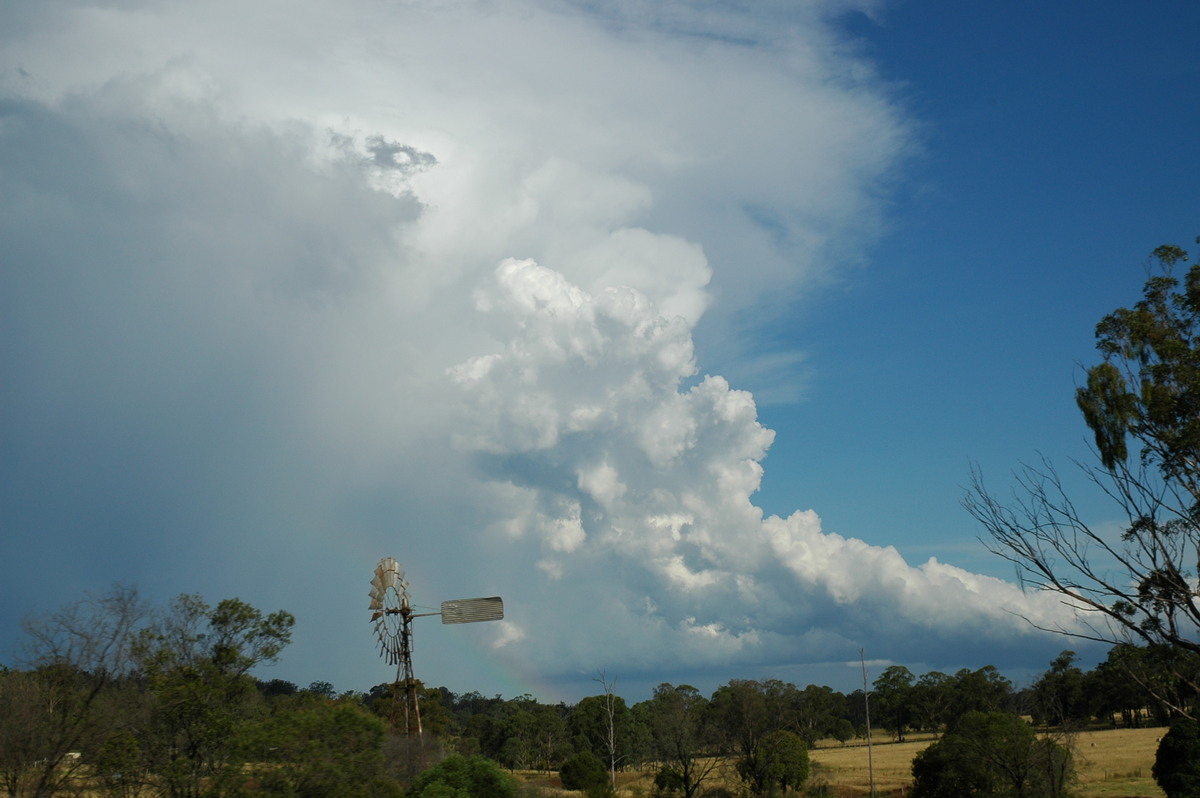
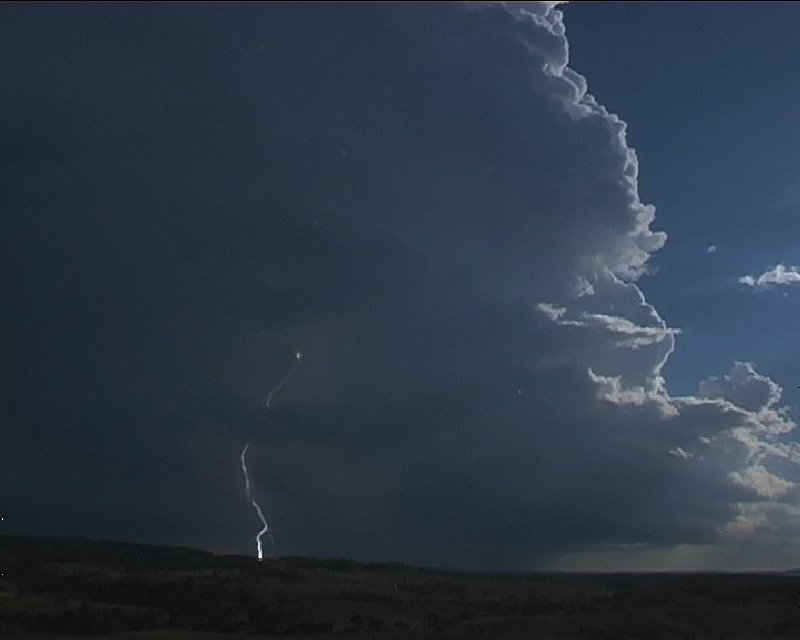
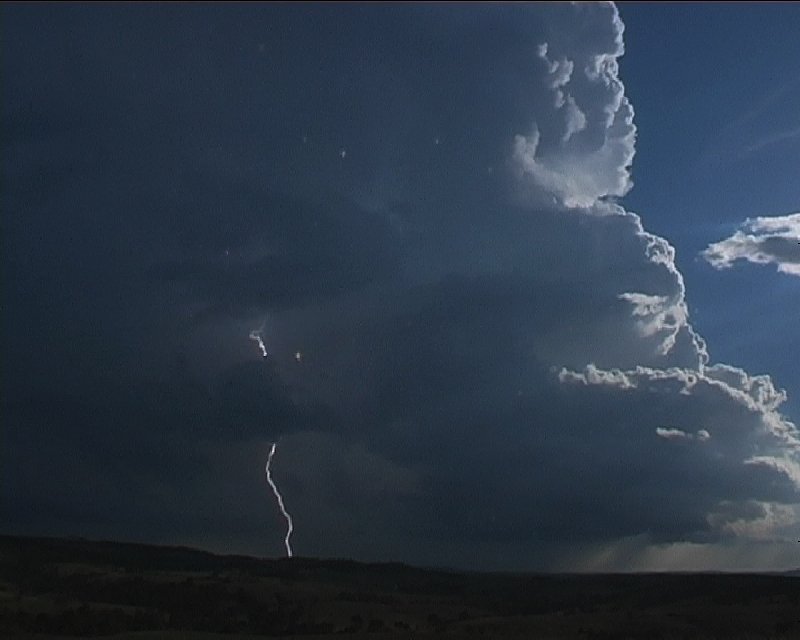
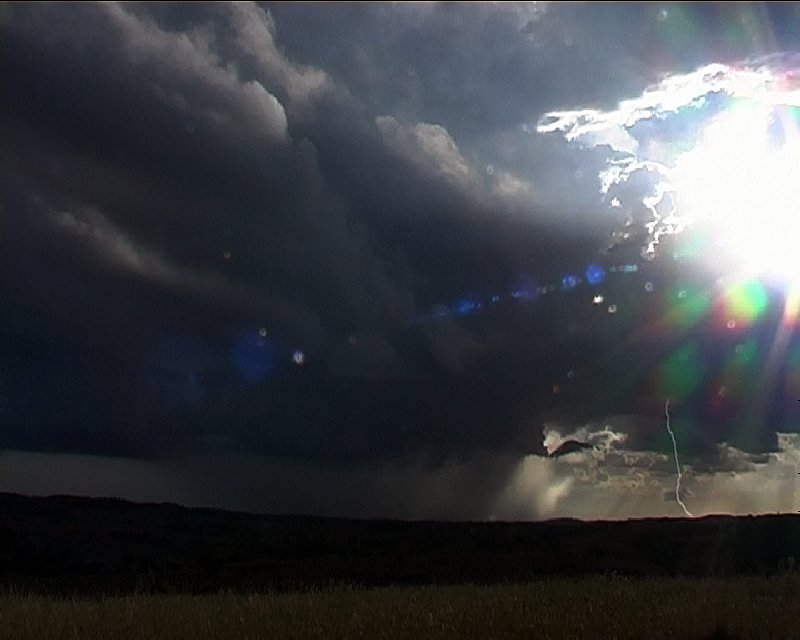
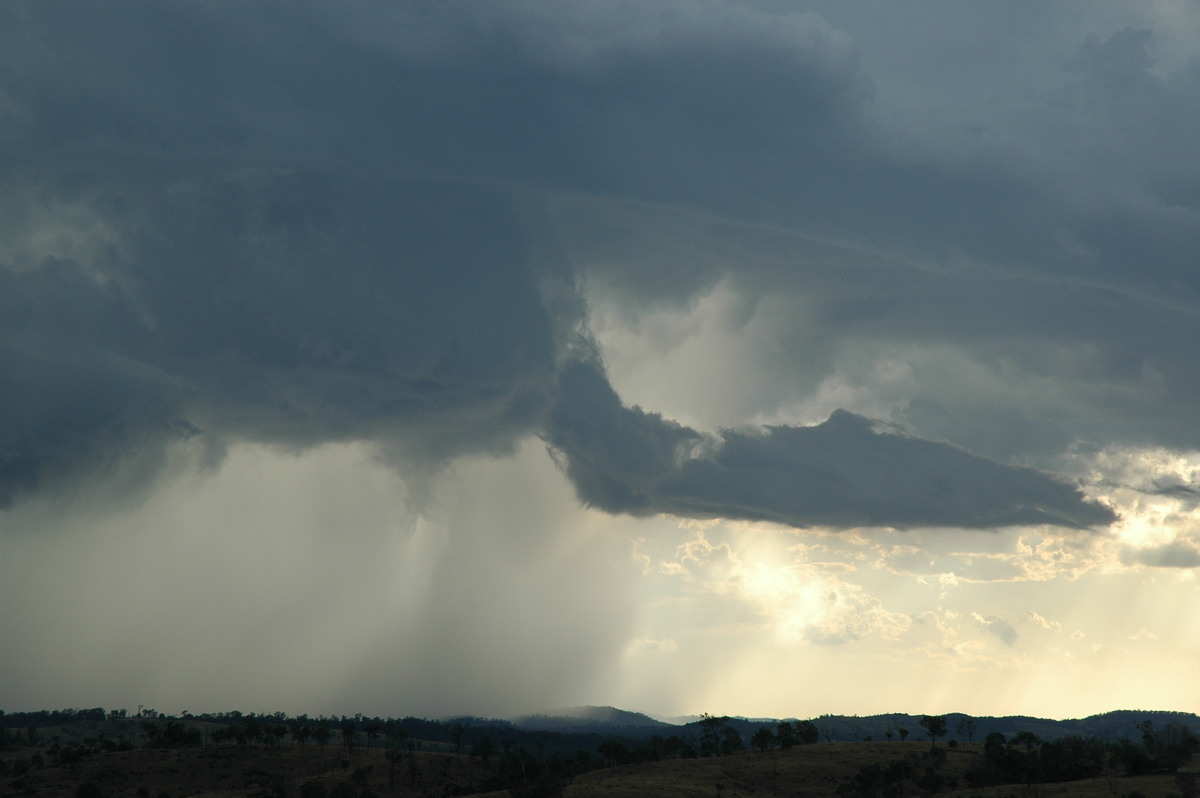
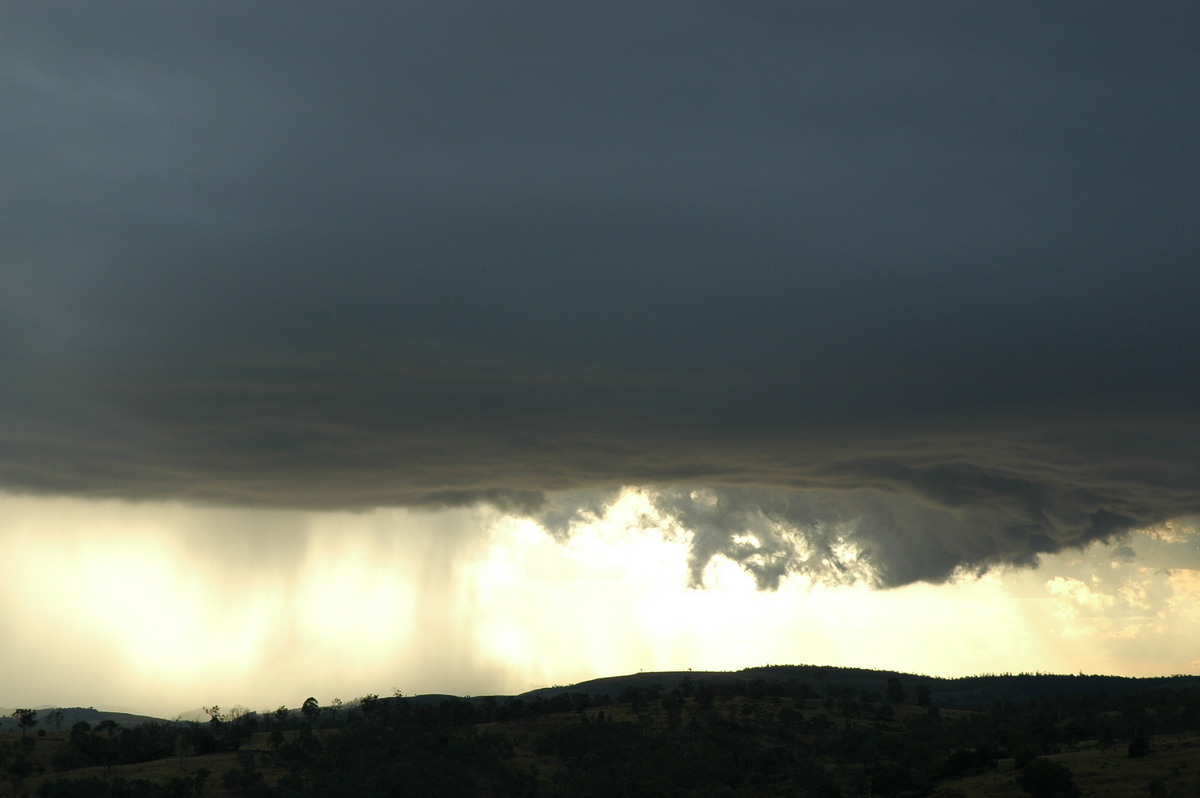
We moved a little further south and found a great vantage point overlooking the valleys to the west. From 5pm onwards we watched the thunderstorm develop near Mount Binga.
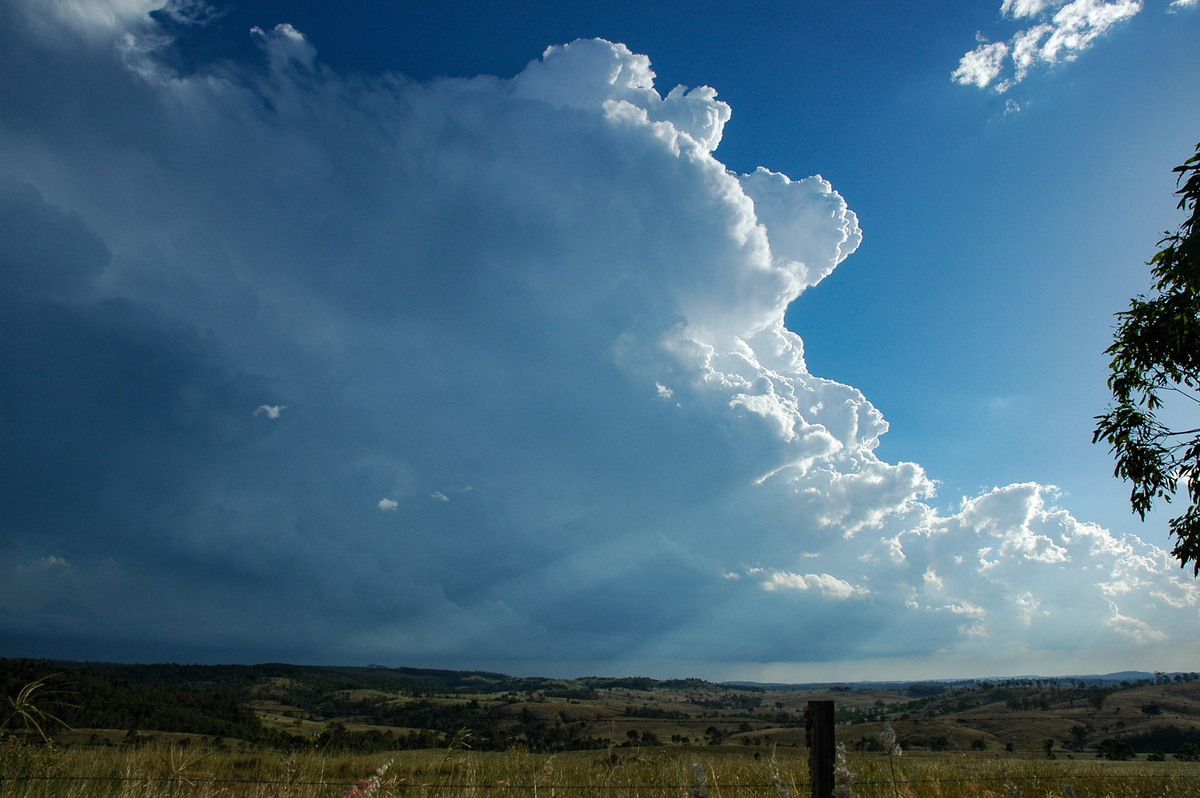
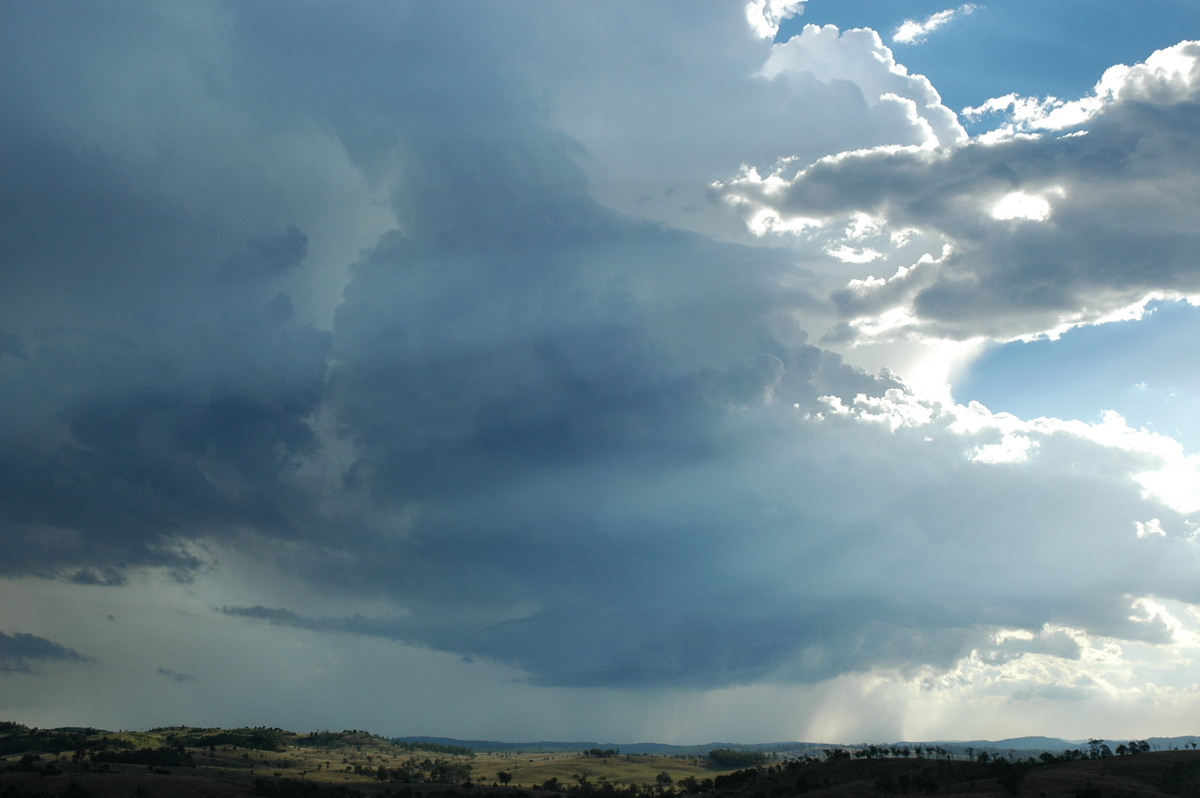
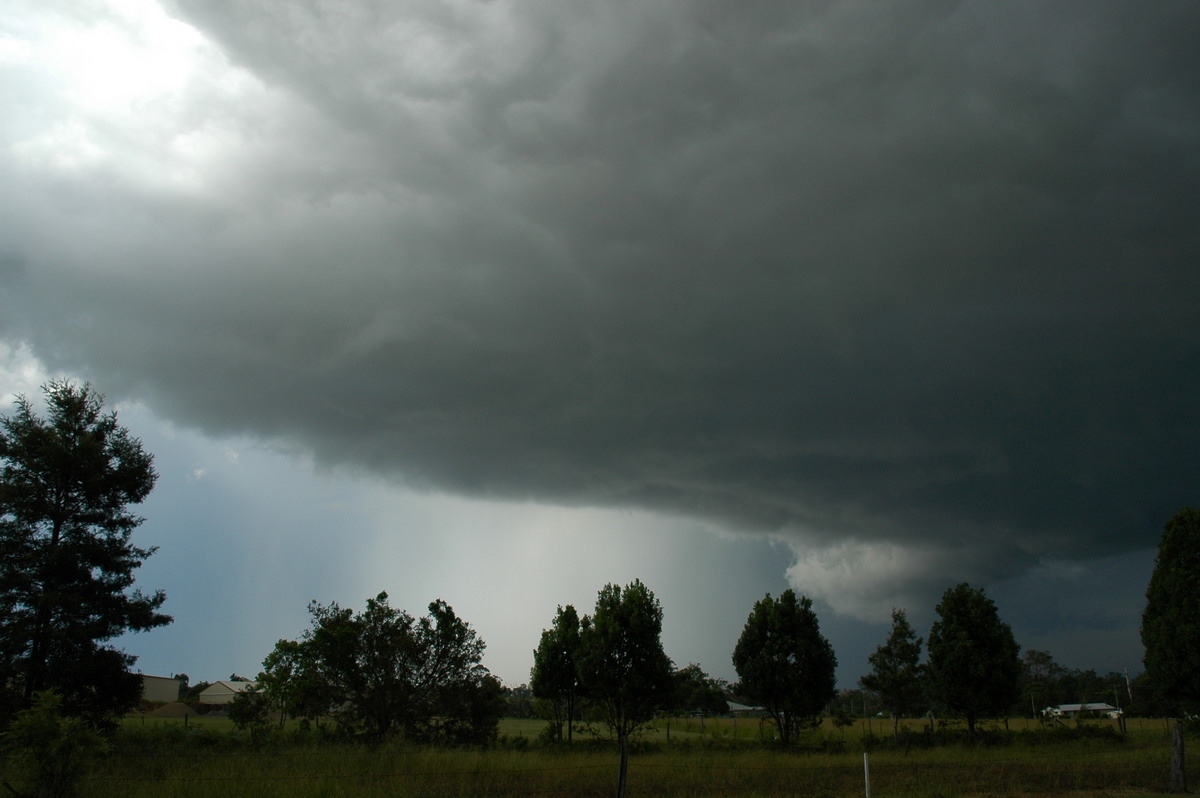
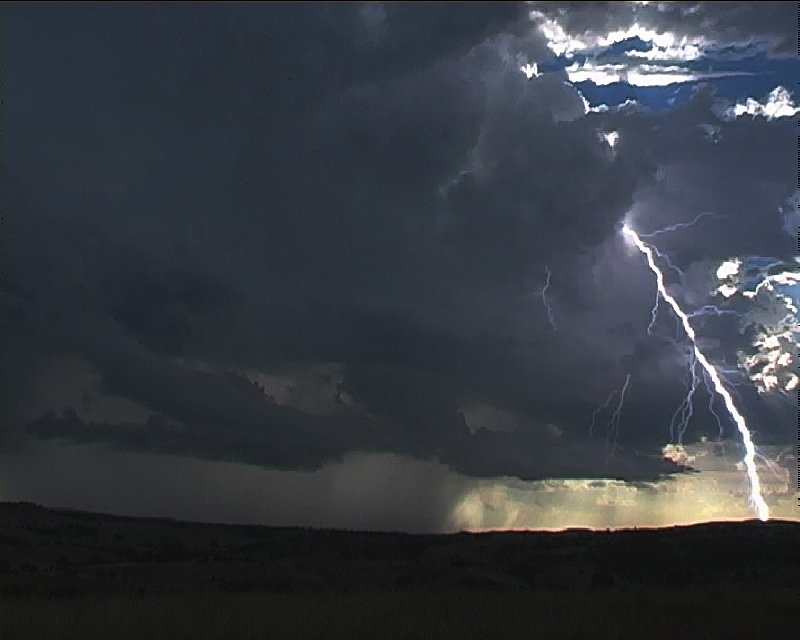
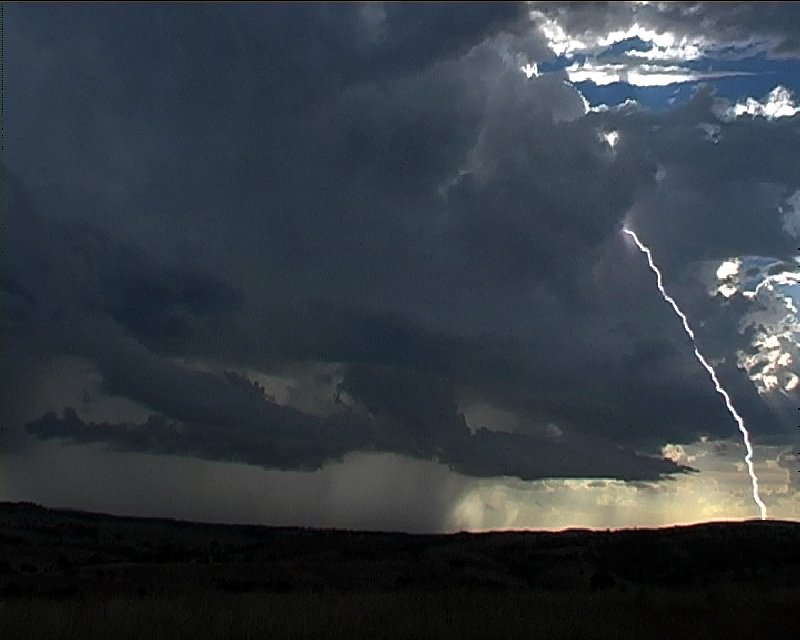
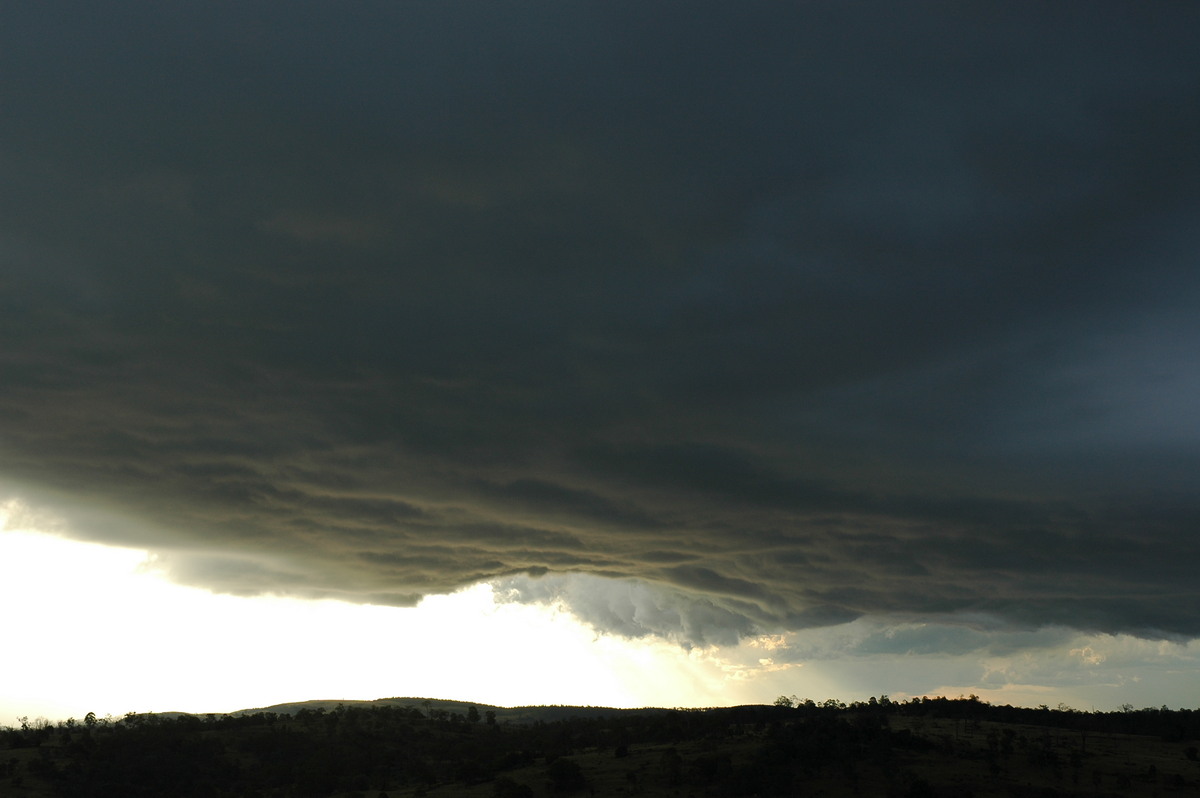
The storm became far more organised and was most likely supercellular - but for perhaps only about 15 minutes. Powerful CGs hit under the impressive base formations, and clear air CGs outside the updraft region.
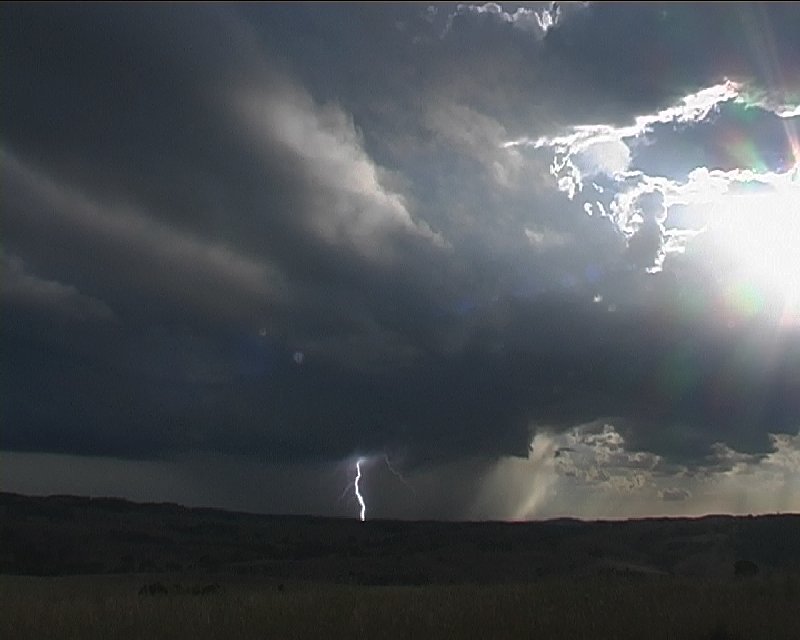
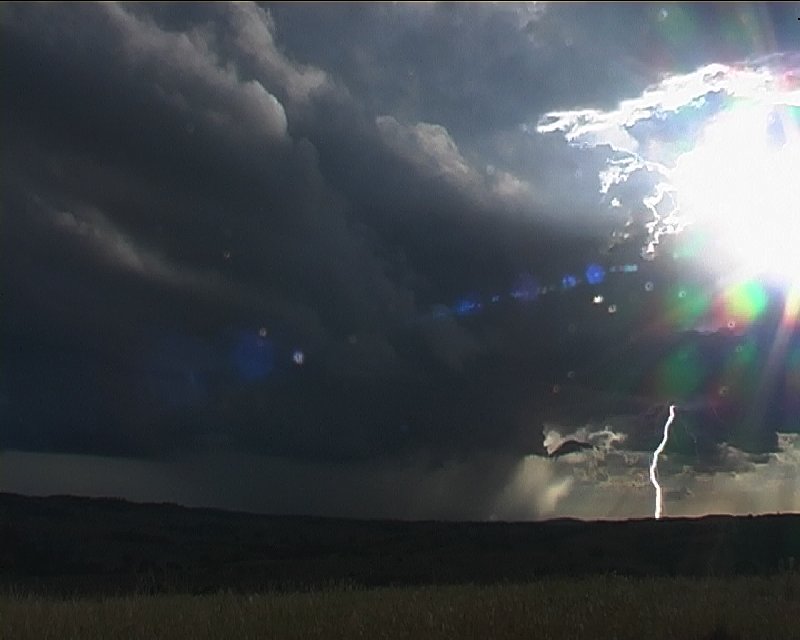
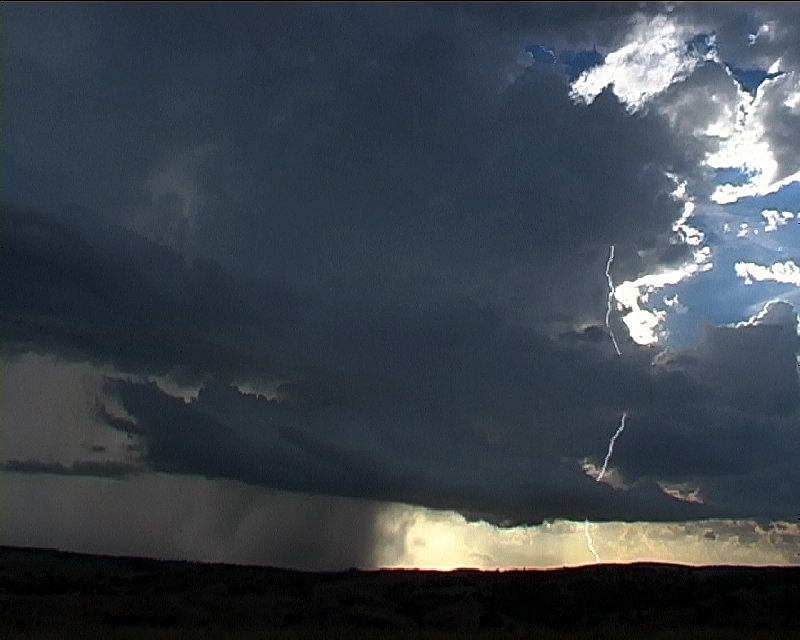
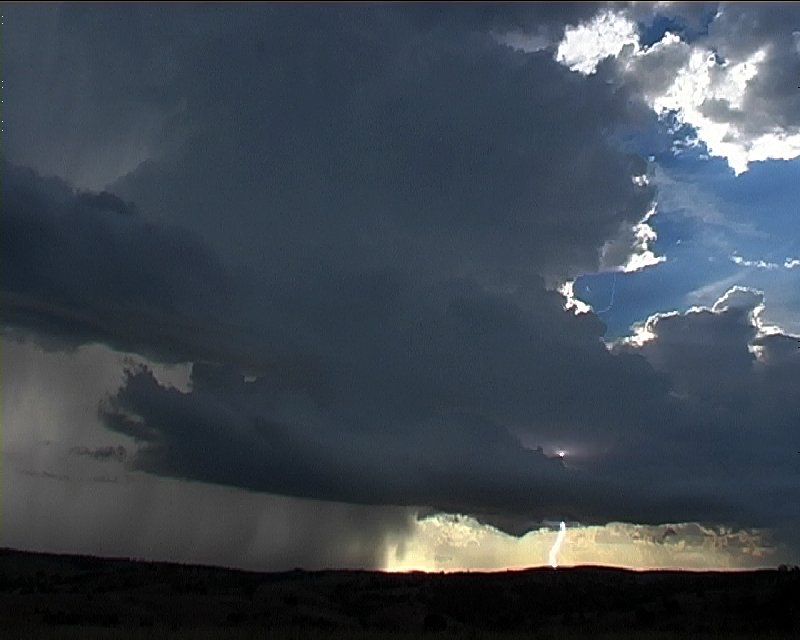
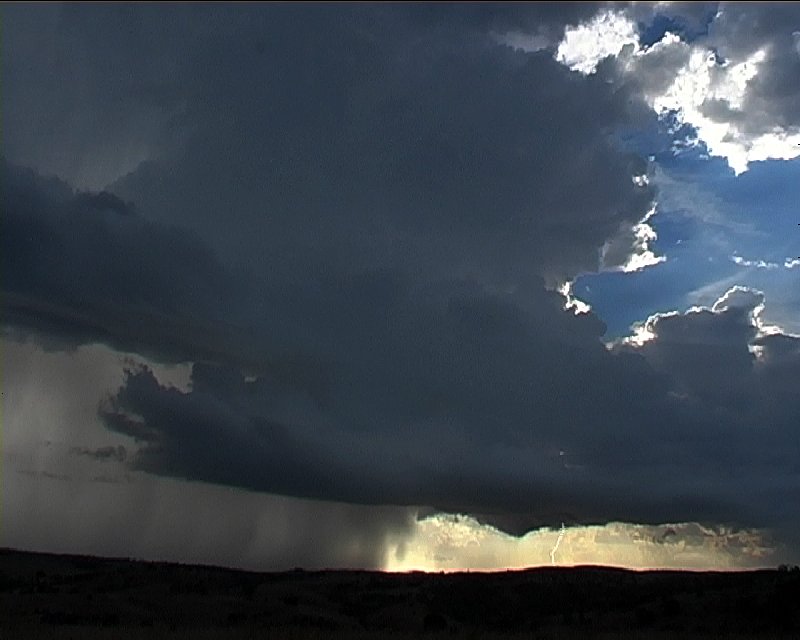
The storm began to weaken at 5.30pm.
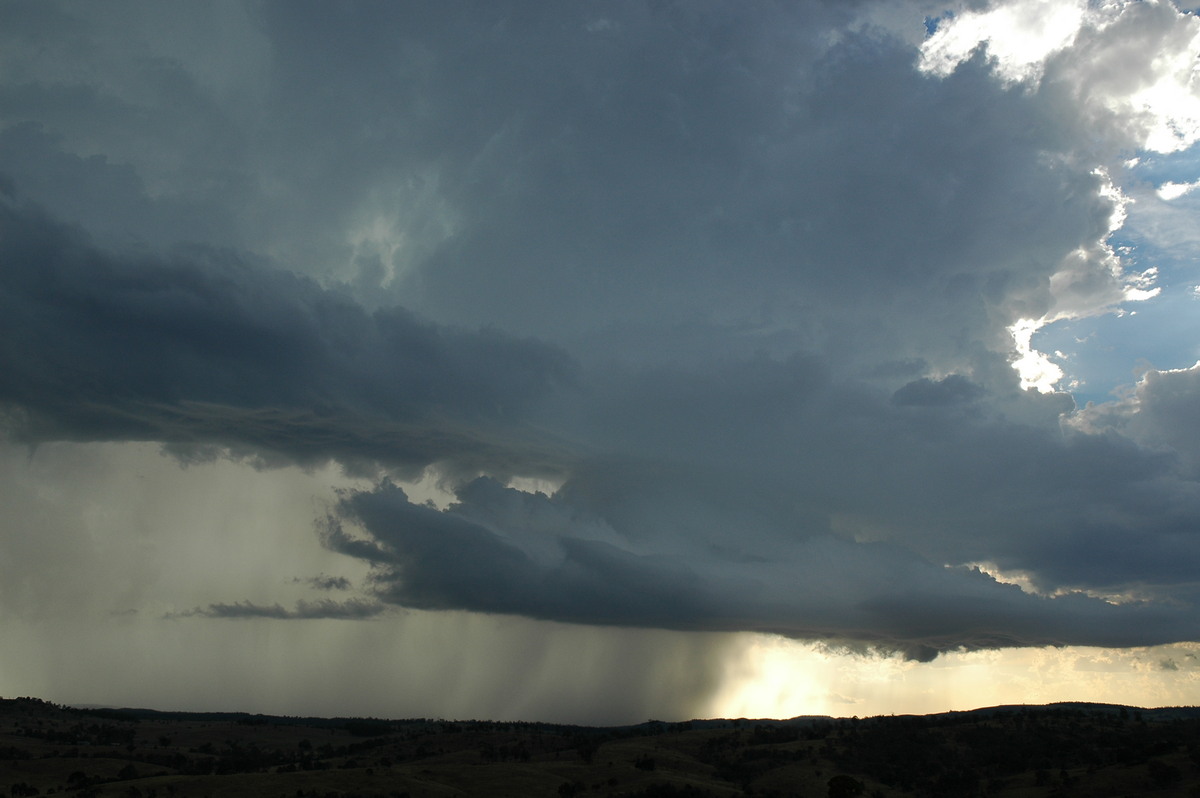
Widespread thunderstorm activity was persisting to the north, but we had to head back south. Paul left for home and Jimmy and I headed back to Anthony's via Toowoomba for the night.
From Bureau of Meteorology
 3pm to 8pm QLD time
From Bureau of Meteorology
 Brisbane sounding at 10am 26/12 local
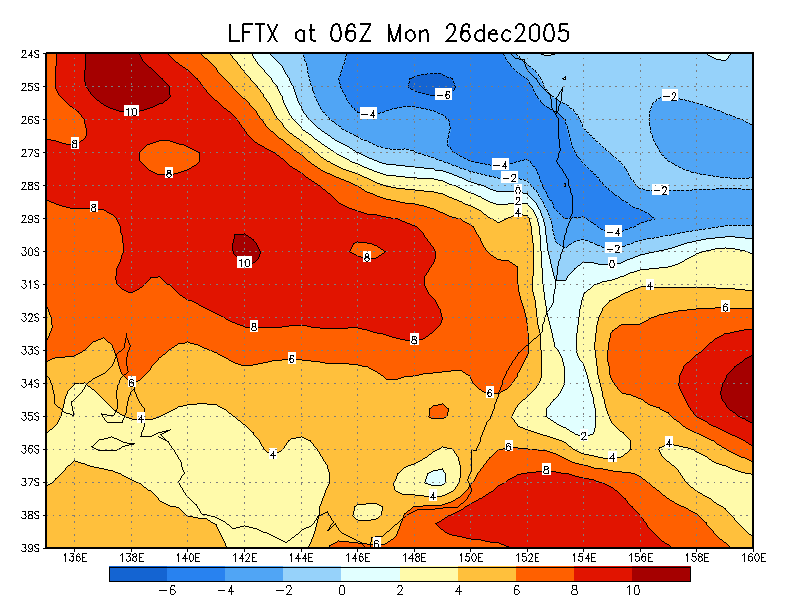
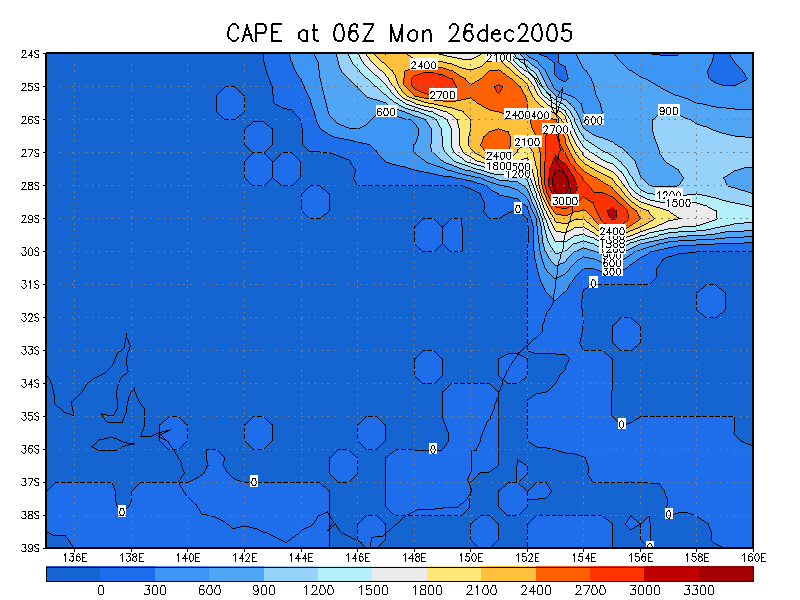
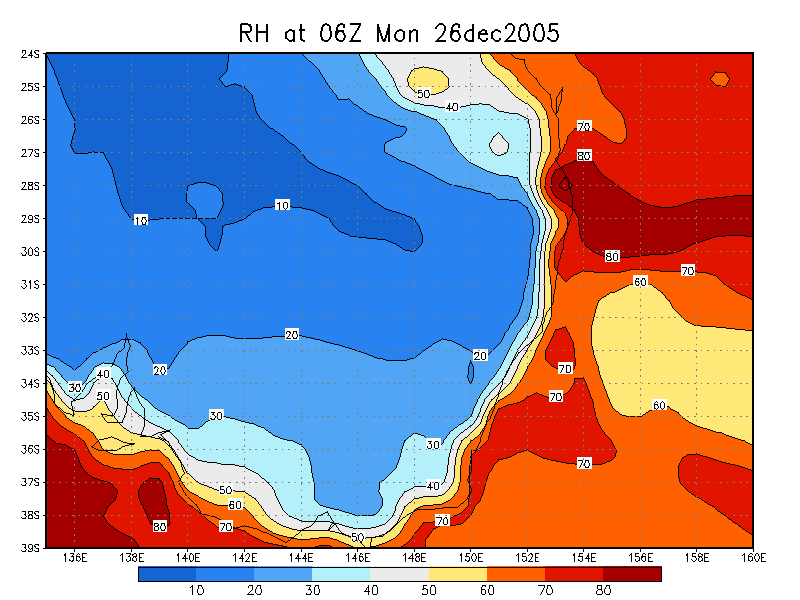
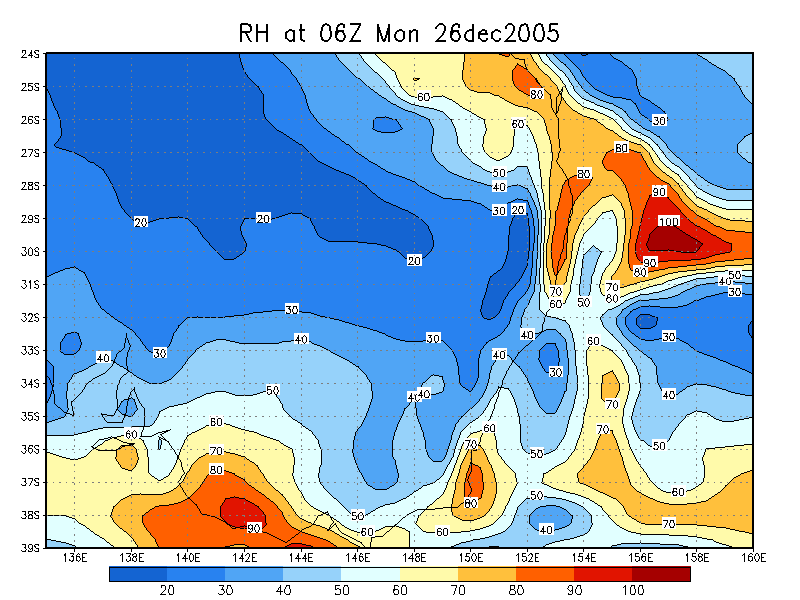
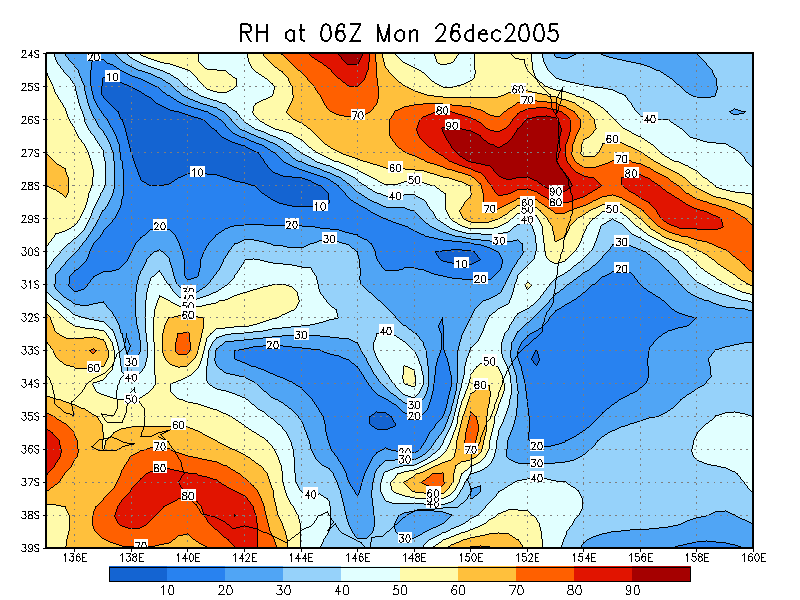
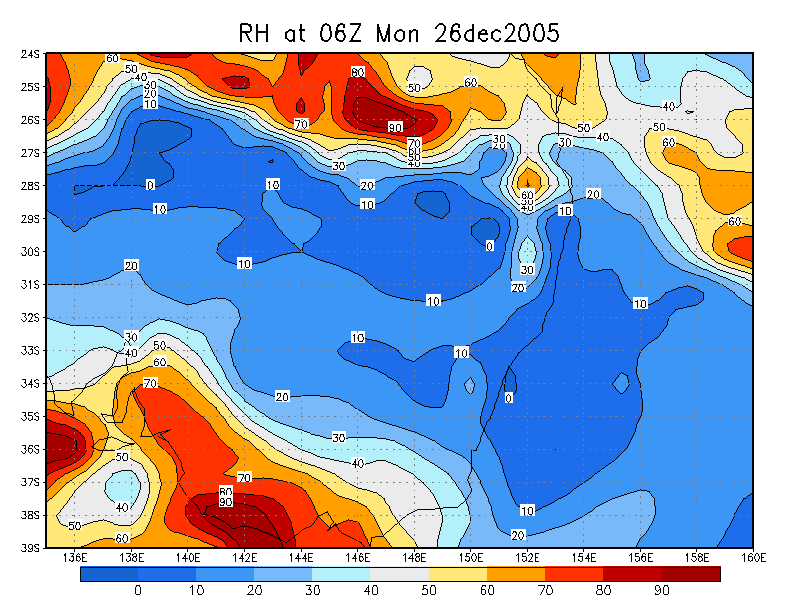
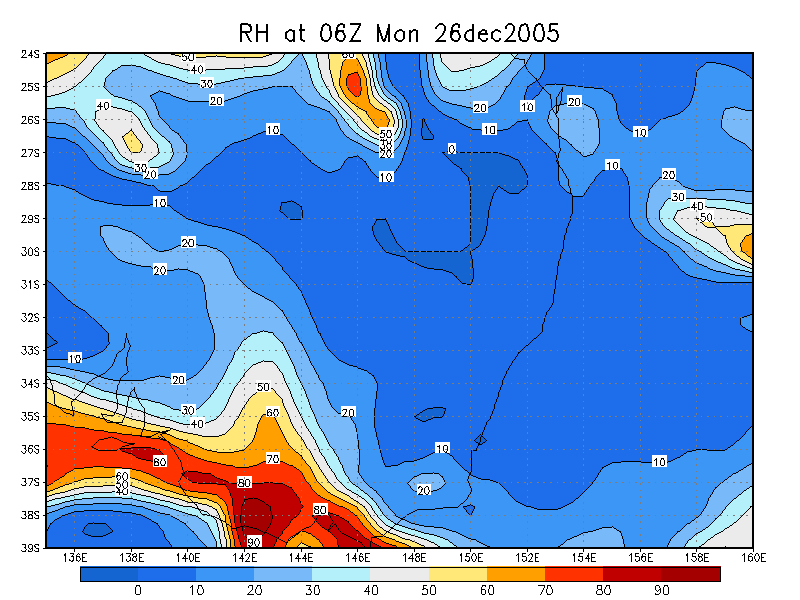
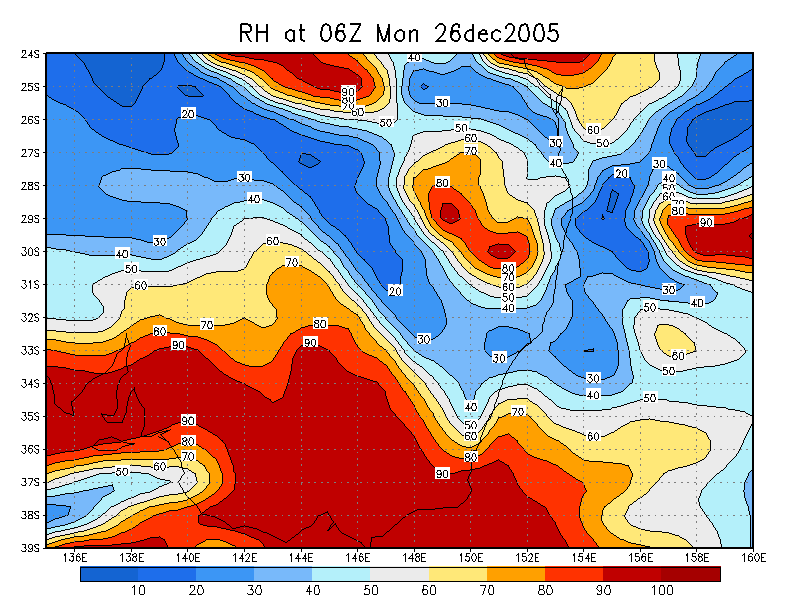
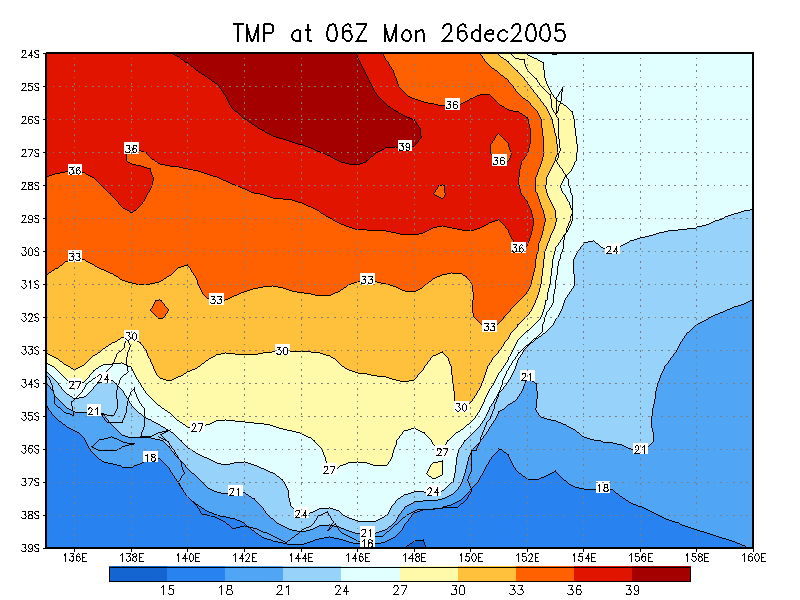
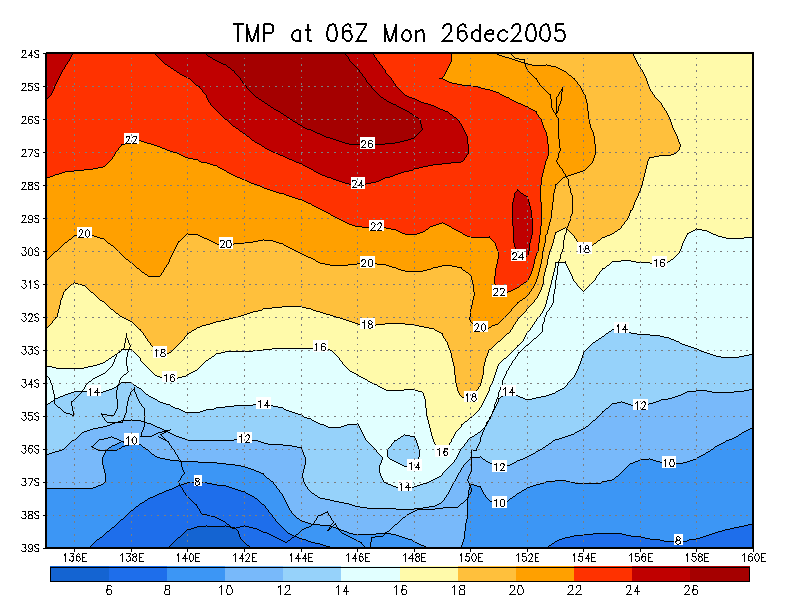
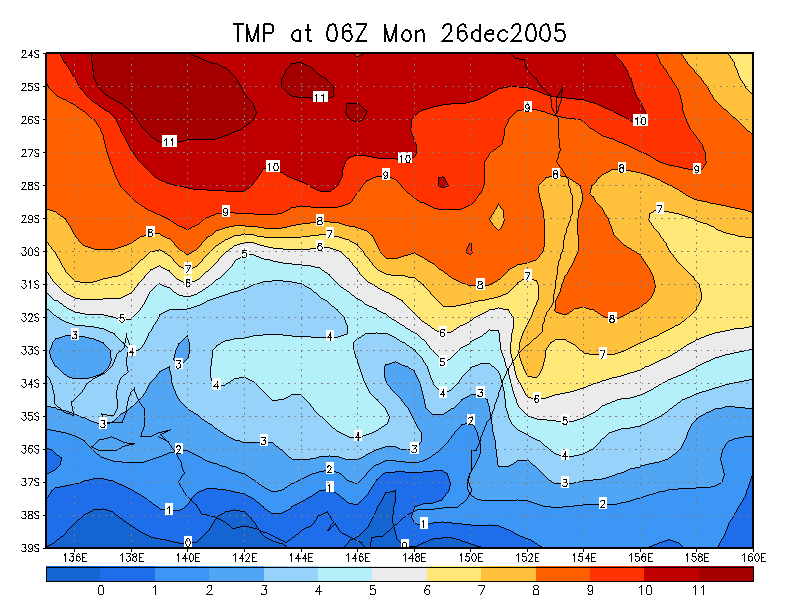
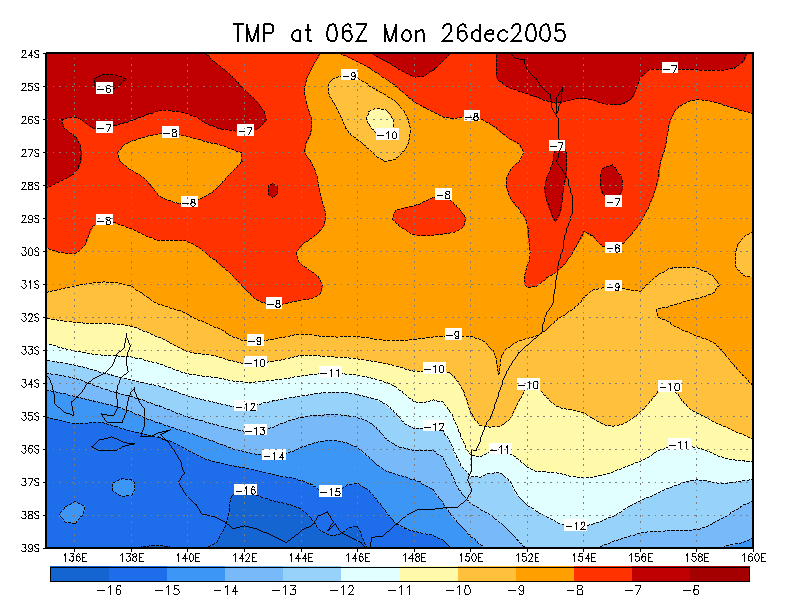
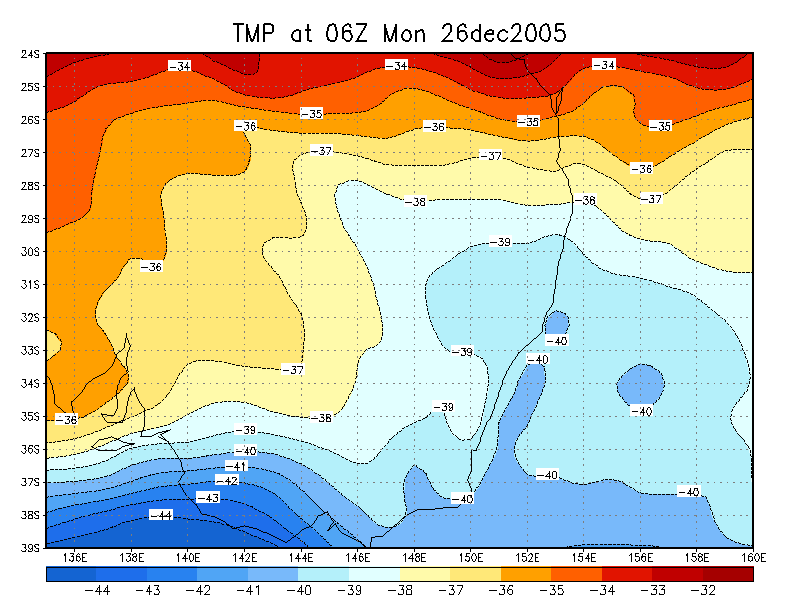
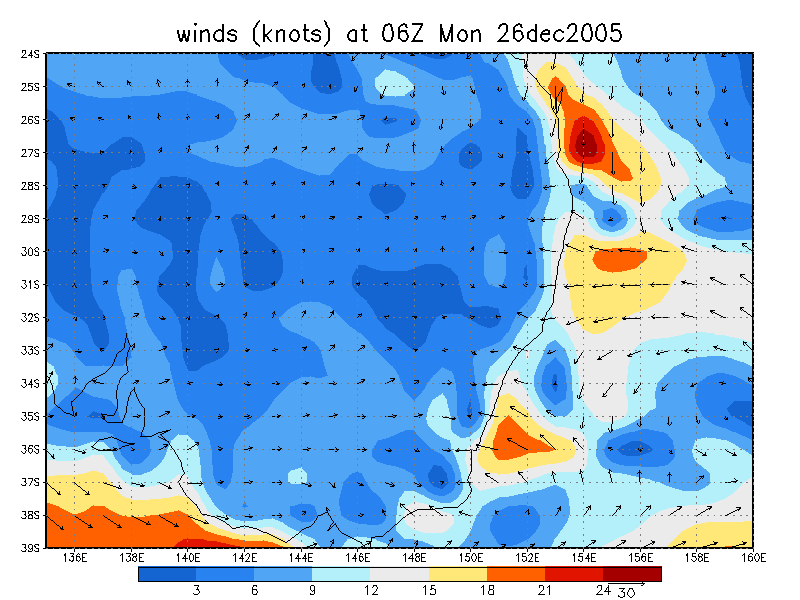
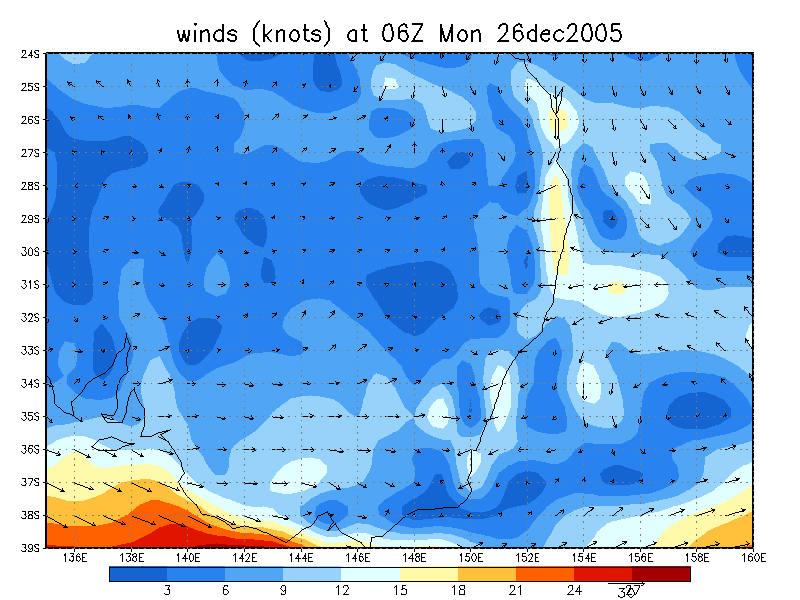
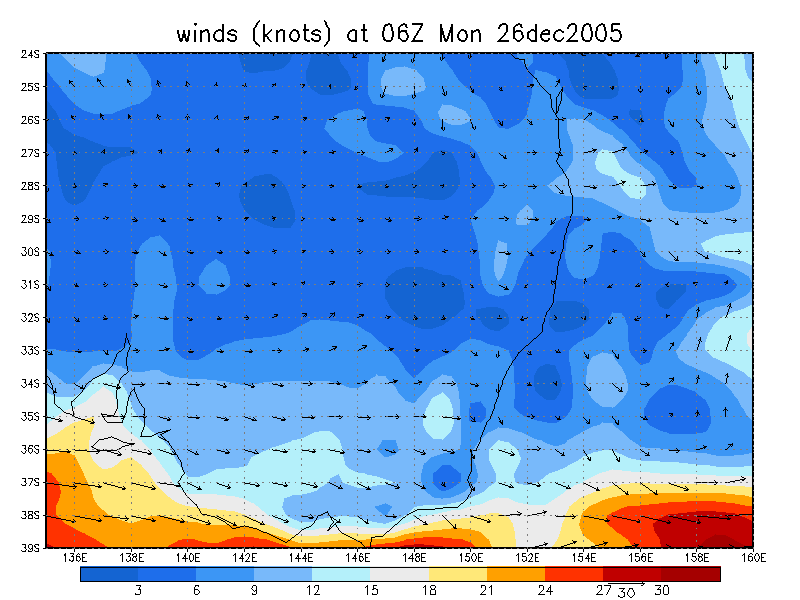
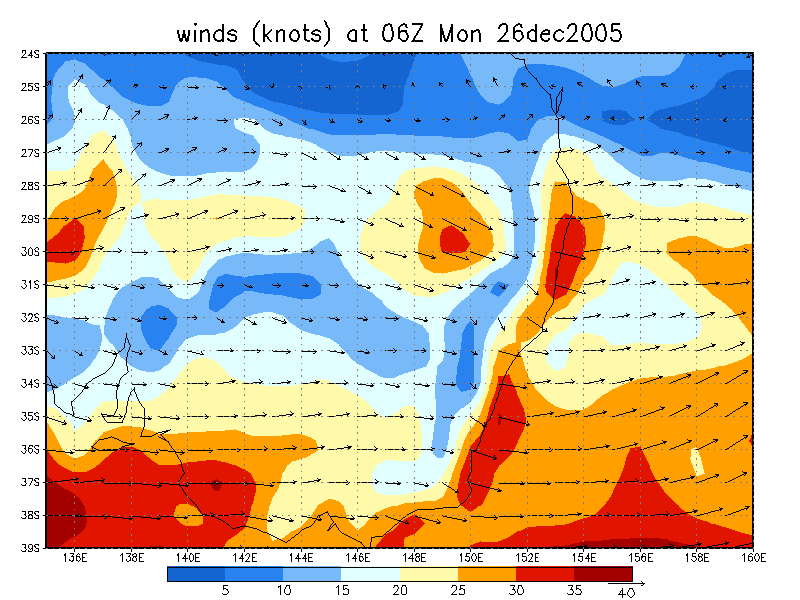
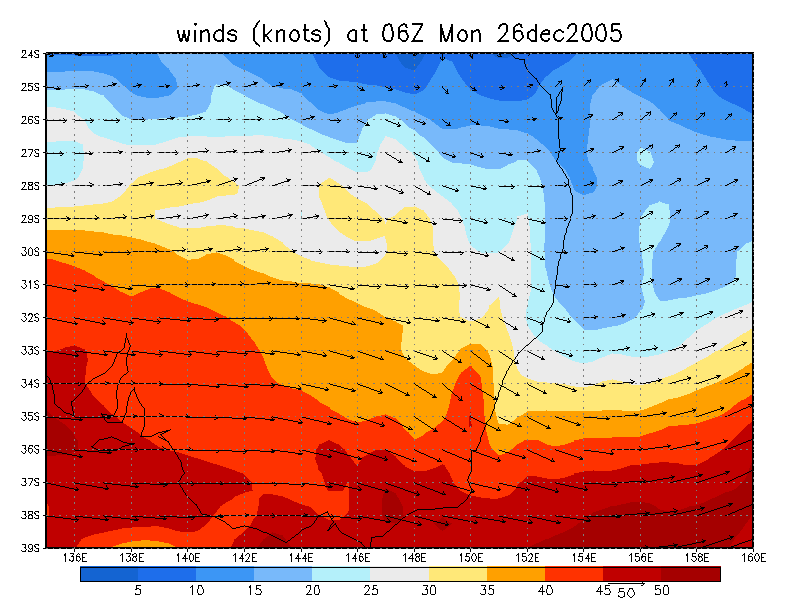
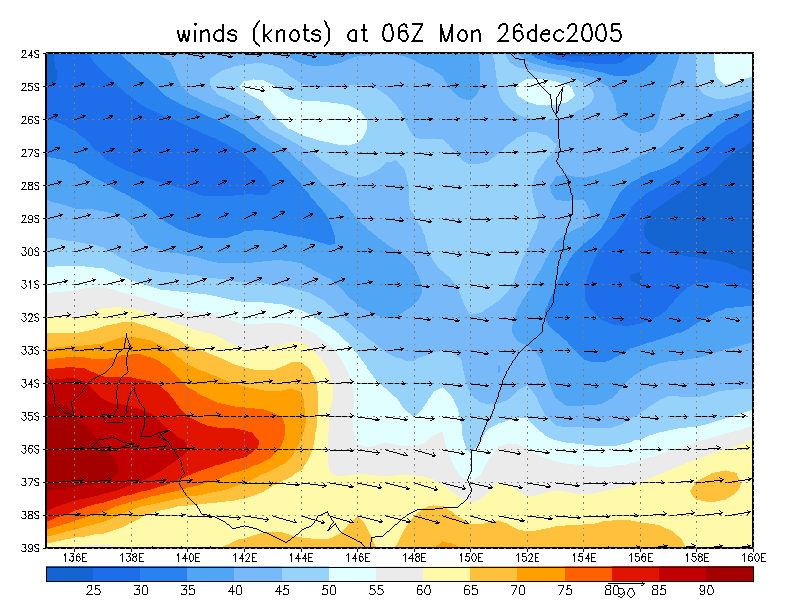
From NOAA 26/12/2005 06z forecast from 25/12/2005 12z run
|
Document: 200512-10.htm Updated: 24th January 2006 |
[Australian Severe Weather index] [Copyright Notice] [Email Contacts] [Search This Site] |