and Chasing
[Index][Archives]
Northern Rivers Storm Outbreak Part 3: Wednesday 28th to Friday 30th of January 2004
by Dave Ellem
| Storm News and Chasing [Index][Archives] |
Northern Rivers Storm Outbreak Part 3: Wednesday 28th to Friday 30th of January 2004 by Dave Ellem |
For the previous three days of storm activity, check out part 2 of the nine day outbreak.
Wednesday 28th of January
500hPa and 300hPa temps had dropped down to -12C and -40C respectively thanks
to an upper trough. An area of -6 LIs and 2000 CAPE was sitting right on the
coastline - reaching an amazing -10 and 4000 well offshore! Shear profile
was excellent, with great low level turning and reasonably strong winds at
all levels. The lower levels were unfortunately very dry, as were upper levels
and strong capping was also present. It was a difficult day to pick - I was
unsure whether there would be sufficient moisture for storms to develop. If
they could, impressive coastal and offshore supercells with explosive updrafts
were highly likely. The Bureau had hinted at this with their forecast, which
stated storms with damaging winds and large hail were likely during the afternoon.
I nearly fell over when at 1.28pm I looked out to the west and saw a storm
developing! It was so dry and capped in that area! But sure enough, after
one or two updrafts it completely evaporated - anvil and all!
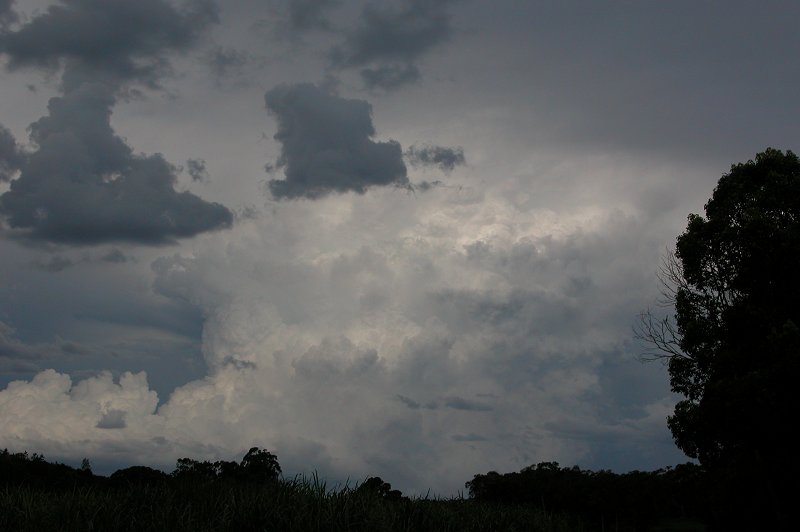
Further weak convection which was high based and low topped developed throughout
the coastal area of the Northern Rivers by around 3.00pm, giving some local
thunder. It was't until 4.00pm that some slightly stronger looking convection
occurred to my SW. It was also high based, but the updrafts looked quite strong.
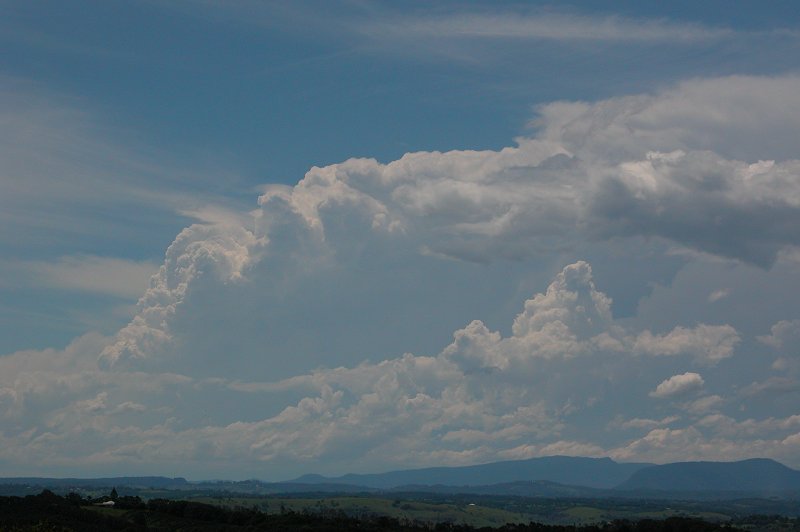
This continued to explode as it got closer to the coast. Another cell developed
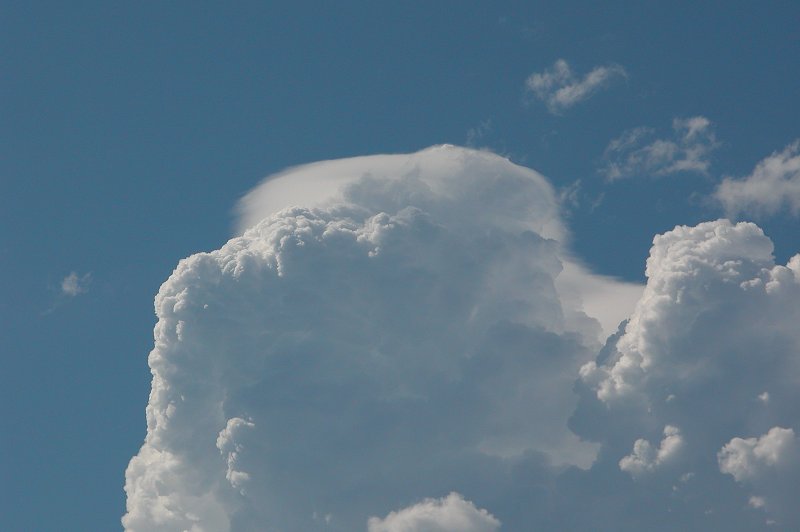
just NNW of my home at 4.20pm, producing explosive updrafts topped with pileus.
By 4.40pm this storm produced a nice lowering which was quite significant
given the very dry lower levels. I believe had the LCL been lower, it is likely
this cell would have become quite a supercell.
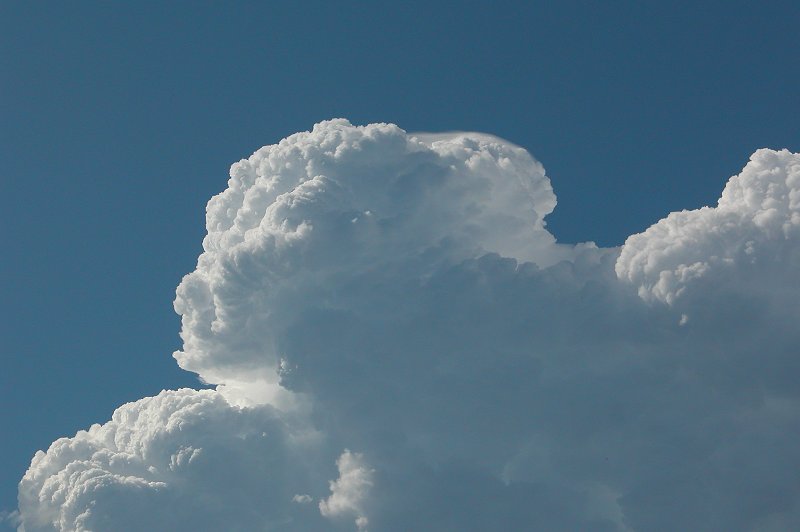
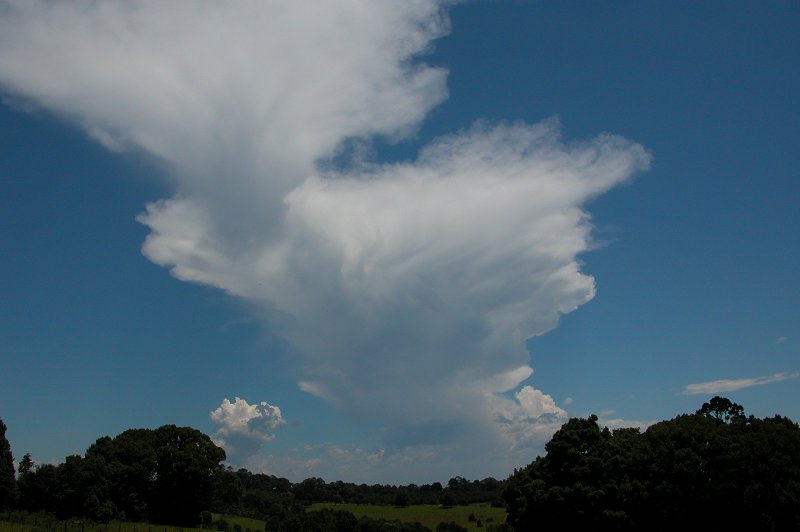
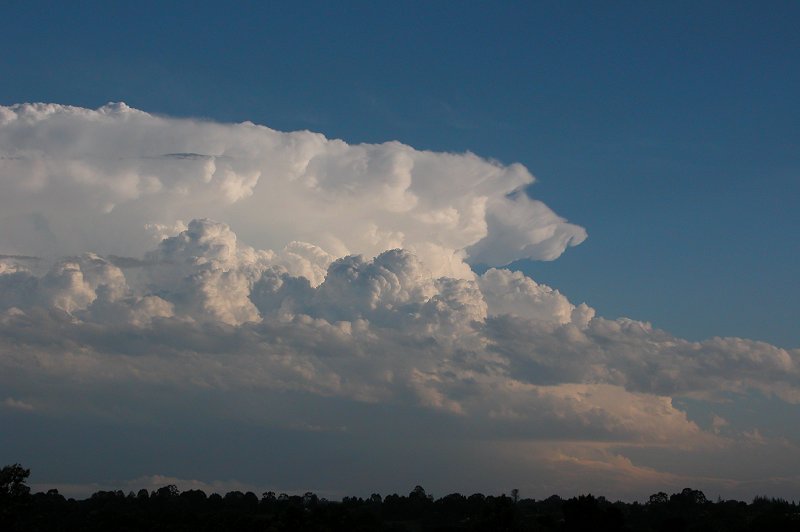
Three storms sitting just on the edge of the coastline south of me, each around
30-40km apart from one another, were just exploding - some of the most amazing
updrafts and solid anvils I have ever seen. It was quite spectacular to watch!
The strongest of the three cells was the one furthest from my location and it
soon exhibited both visual and radar features which indicated it was a supercell.

It was now 5.05pm and attention turned back to the cell which was earlier
NNW of my place. The cell had now moved over Byron Bay and produced some incredible
structure. I am unsure what the lowering at the back of this cell was, but
it sure caught my attention! The cell had a solid red core on radar just off
Byron Bay. Soon after it split, however it was the left mover that weakened
and died, with the right mover continuing on out to sea.
Meanwhile the cells off the coast to my south continued to explode and had
quite large red cores on radar.

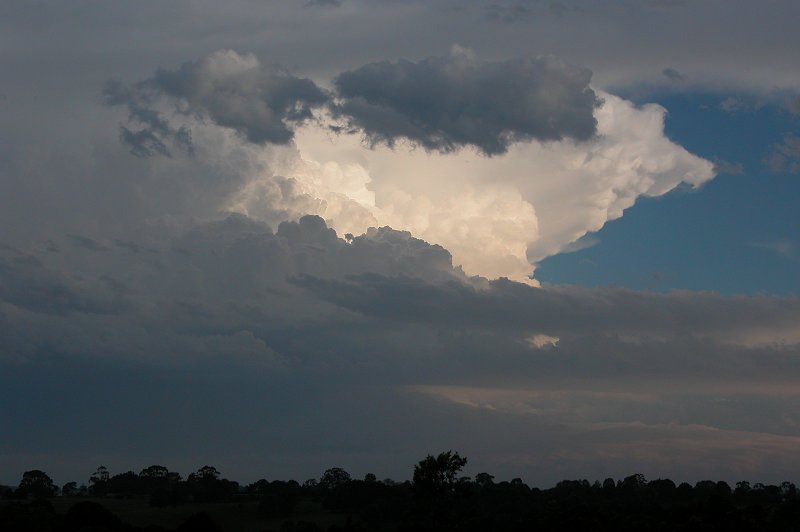
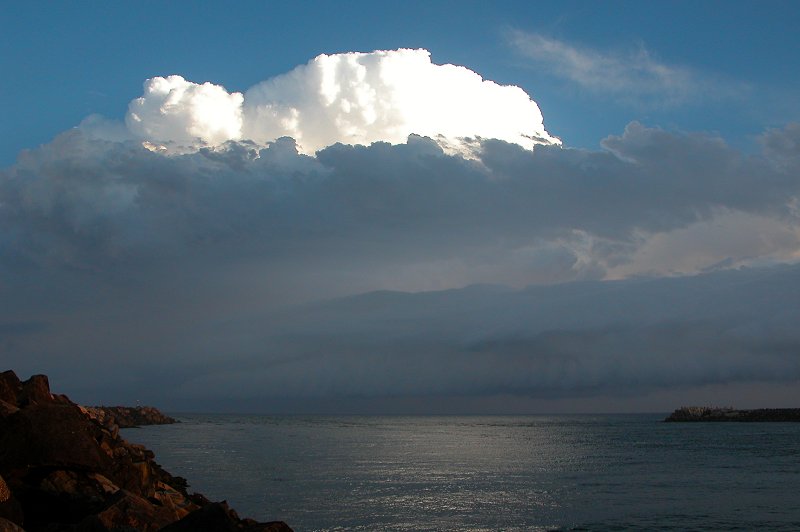
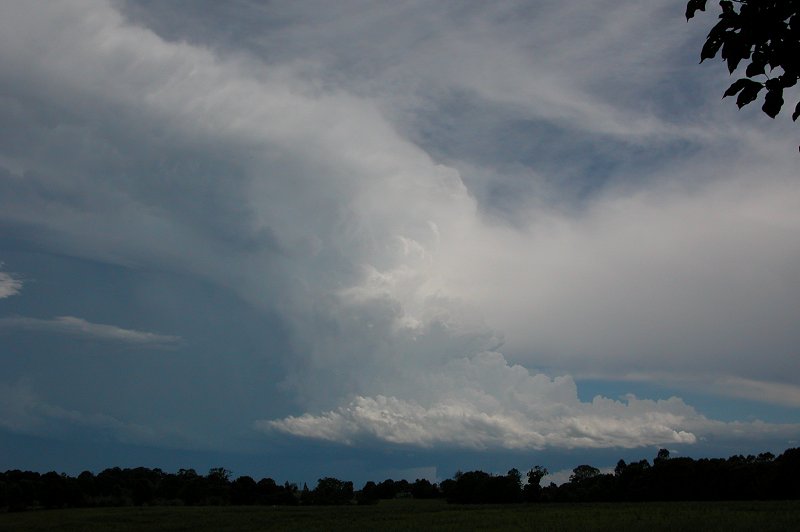
At 5.50pm, more strong updrafts were visible at the back of the cell which had
moved well offshore but was now almost east of me. Some nice pileus was observed
on the updrafts. But the really serious activity was further south, with quite
a large supercell just exploding off the coast! Everything about it was solid,
and as it moved closer, base features were starting to become visible.

At 6.34pm The back of the severe squall line which had moved through SE QLD
was visible now to the NE, although it wasn't nearly as entertaining as the
more solid updrafts closer to our area (although the base features sure kept
the SE QLD's entertained!). It was also now apparent that the supecell to
my ESE was veering significantly left of the mean steering winds. At one point
it looked to almost veer NNW on radar!!!! A massive inflow band feeding into
what looked large like a mesocyclone could be made out in the distance. At
7pm I decided to shoot down to Ballina and watch the supercell in the hope
so seeing some base features.


From Alstonville onwards i could see the large mesocyclone (but couldn't take
pics while driving!) and the large inflow band feeding into the base. The
storm was absolutely huge!! It was however beginning to weaken and veer more
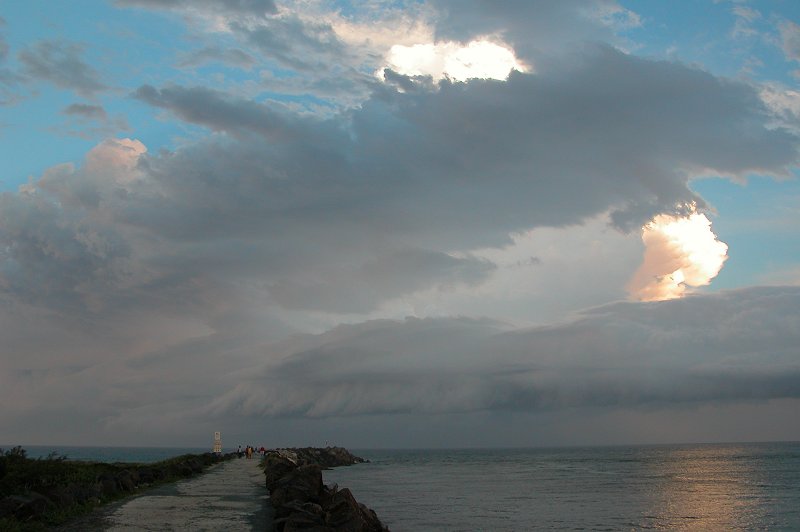
NE than N. After what seemed like an eternity I reached the north wall at
Ballina and snapped photos of the supercell and it's large inflow band. Further
convection N of this supercell was illuminated nicely by the lowered sun.

Beautiful branched CGs were keeping those on the wall watching the storm entertained!
It was great being around a bunch of people who would gasp every time lightning
would jump out of the back of the storm - just goes to show that most people
do enjoy the spectacular show that thunderstorms produce! I had other commitments
so I had to pack up and leave at 7.30pm, so didn't get a chance to photograph
the awesome light show. Not to worry - the structure alone today was enough
to satisfy me!!
Thursday 29th of January
Well we had nice strong shear this day, along with good instability figures,
however the moisture profile was really bad, with way too much upper level
moisture and too little low level moisture. 850hPa temps were above 20C, and
a strong cap existed. The day was dominated by thick high level cloud. Still,
some very high based/low topped convection popped up and gave some thunder
and a brief shower over my home just after lunch. Unfortunately nothing much
developed after that until after 5pm, when some convection on the clearing
edge of the cloud band developed in S QLD/N NSW. Around 6pm a nice storm was
located near Tenterfield and was heading toward our area. At 6.20 it looked
fairly weak visually, but did have a nice solid yellow/green/pink core or
radar. By 6.40pm however, it looked like it was weakening both visually and
on radar.
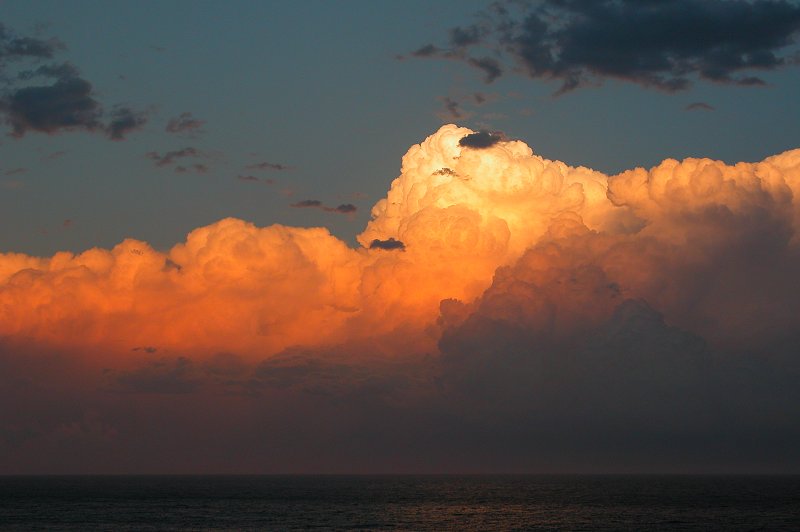
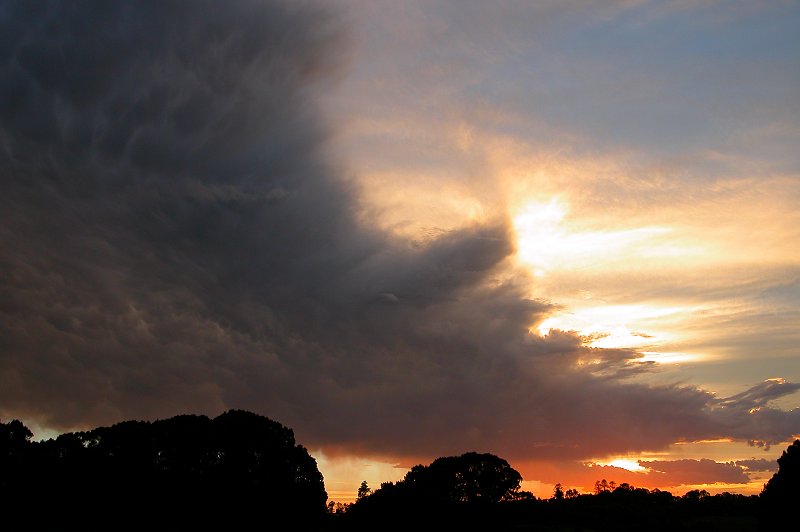
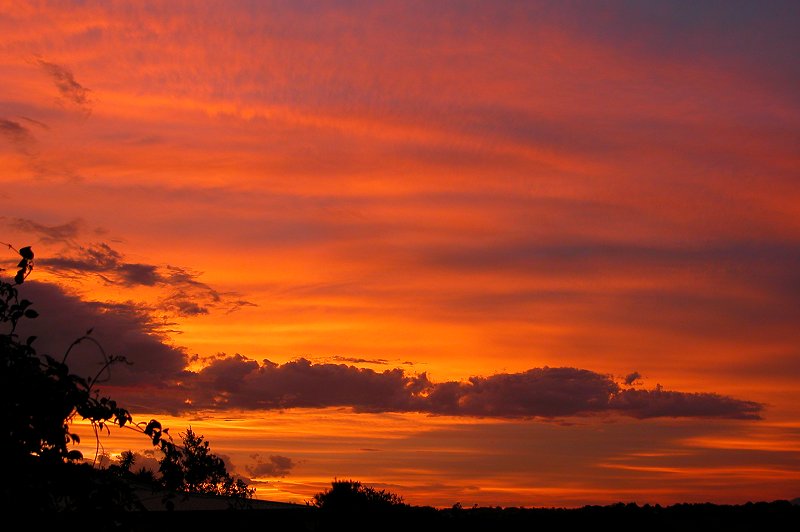
I had to go into Lismore briefly and hoped this would then develop into a
chase, but it wasn't to be, and when I returned home at 7.45pm, all that remained
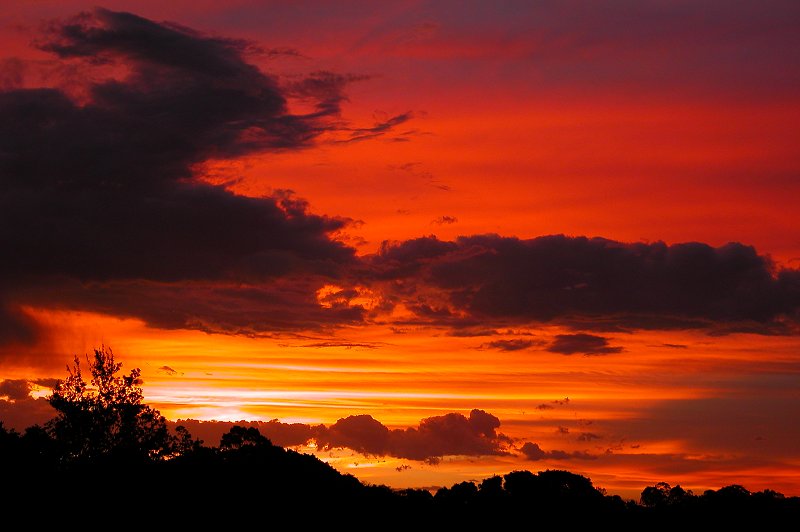
was an anvil with a bit of mammatus. We were however treated to a very intense
sunset which I quite happily watched evolve of a period of about 10 minutes.
Friday 30th of January
The storms that developed on this day proved that you shouldn't put all your
trust in the models! After reviewing AVN you would have been left thinking
that there wasn't much chance of storms - it forecast that most of the moisture
and instability would be pushed offshore quite early. After seeing that I
didn't pay too much attention to other variables, but as it turned out it
was an impressive setup! Shear was perfect for supercells - almost 90 degree
turning between the surface and 700hPa, reaching 24kns @ 850hPa and 45kns
@ 500hPa. Shear like that makes you consider the possibility of tornadoes
occurring! The upper trough had not only strengthened wind shear, but kept
the upper levels nice and cool, reaching around -40C at 300hPa.
Weak convection started around 1.00pm. I noticed some weak congestus when
I was shopping and figured that would be as exciting as it got. I got home
and did some work when at about 1.40pm I noticed some convection developing
just SW of Casino. It was weak, as expected and so I kept working. A quick
check of DPs on the ranges to the west confirmed there was more moisture than
had been forecast, which was encouraging! Around 2.40pm I went to get a visual
on the activity which was now to my SW. I was shocked to see quite a solid
looking anvil and a base that was actually quite low (compared the last couple
of days). Storms were also developing in S QLD.
I checked outside again at about 2.50pm and the cell to my SW looked a little
weaker. The updrafts weren't all that impressive anymore, so I went back to
work inside. What a difference 10 minutes make! Another visual after looking
at radar and seeing stronger reflectivities confirmed this cell was in fact
quite well organised! A rotating updraft was now obvious and it had an interesting
lowering underneath it which was obscured by some trees.
I didn't need any convincing to go chase, although I was a little put off
by its SE track. I held hopes of it veering left as I ventured out to the
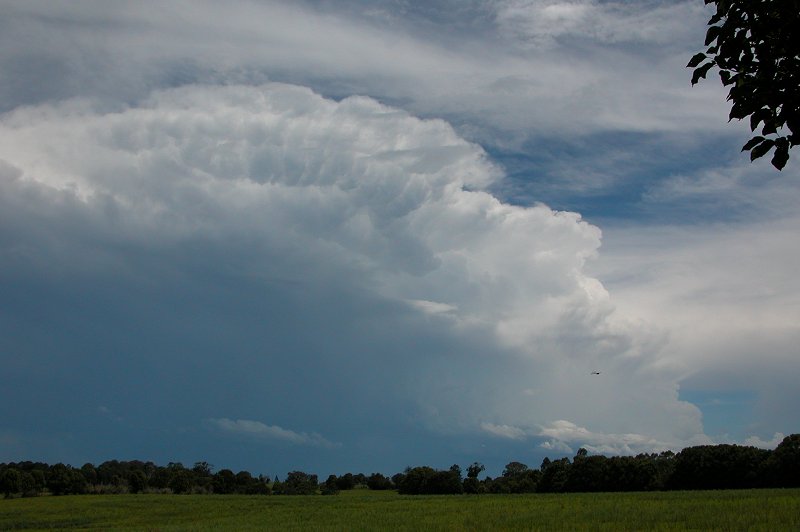
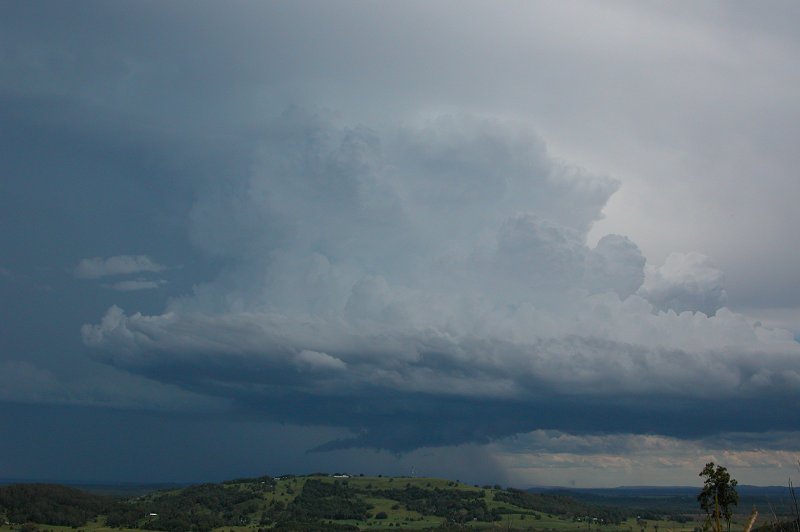
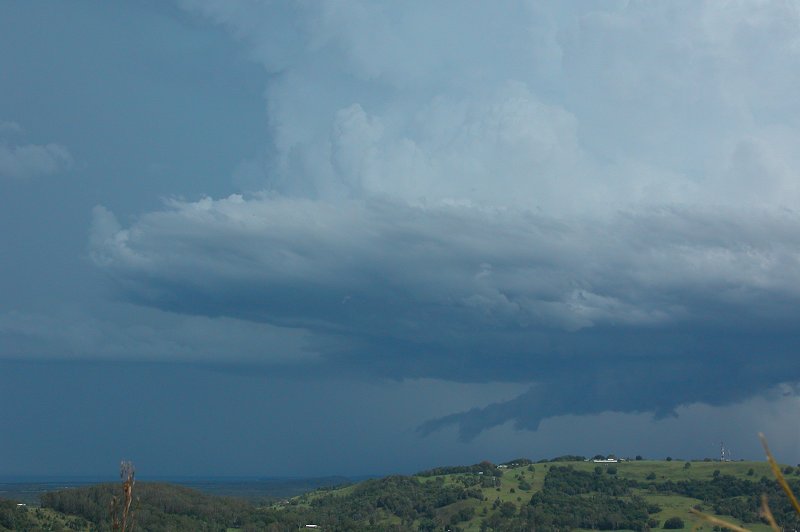
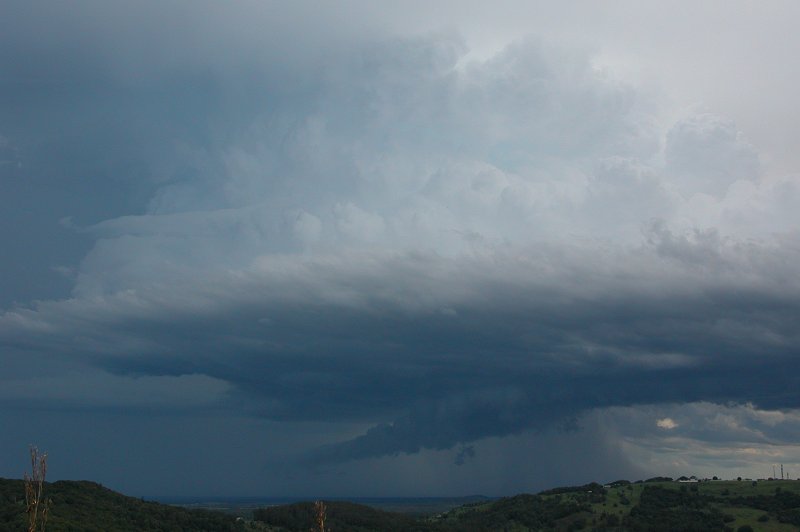
southern edge of the Alstonville plateau. What I saw when I arrived at 3.20pm
almost had me speechless!! A well organised, relatively fast rotating supercell
with a lovely solid anvil spreading east and evidence of good low level inflow!!
And a nice little wall cloud underneath the mesocyclone. It was the fastest
rotation I had observed in 3 years of chasing, and I was not really happy
about the fact the video camera was in Melbourne on holidays with my parents!
That meant no timelapse.....how frustrating!! So I snapped away with my still
camera and watched it evolve.
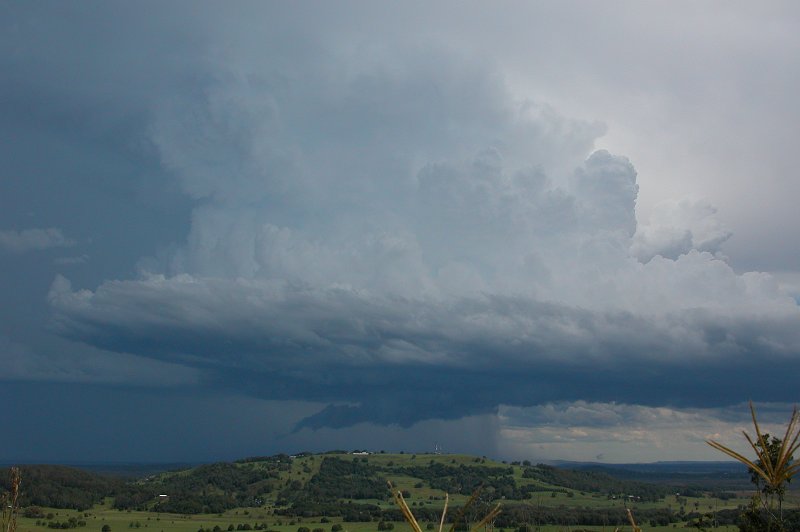
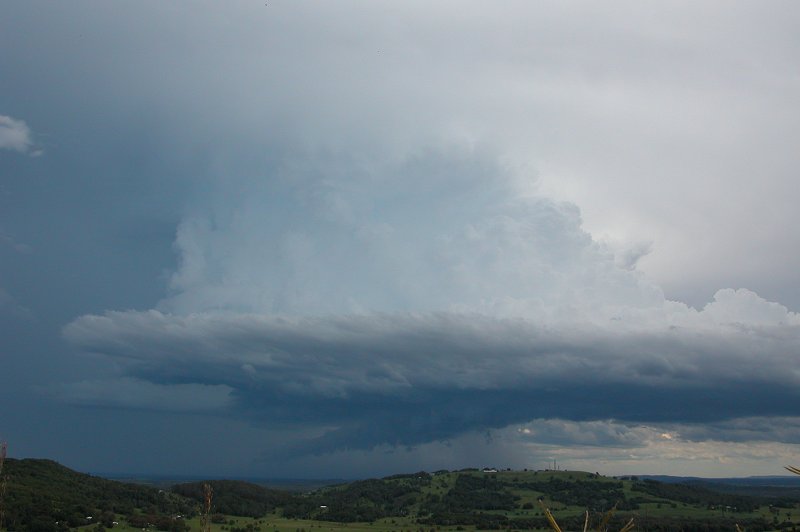
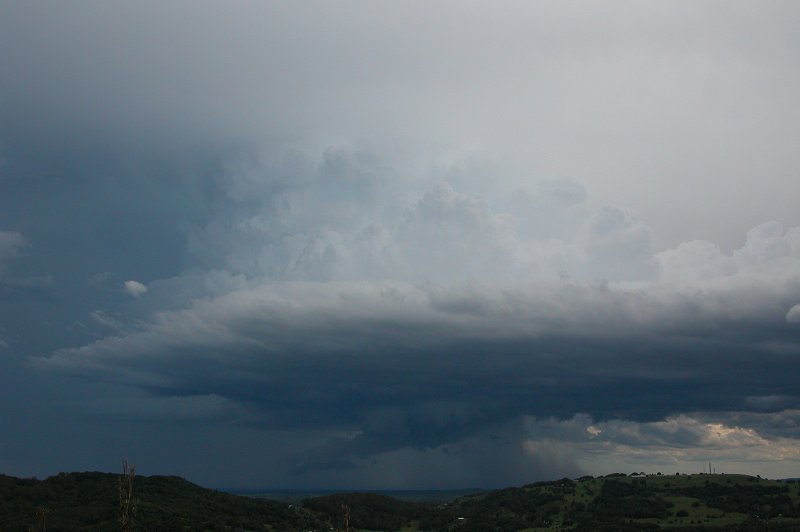
Michael Bath provided a radar update which showed a nice solid pink core and
90 degree turning to the left, from a SE track to a NE track....all in a 10
minute period!!! With the SMS radar update was a message from Michael saying
'does it have a tornado yet?'....well, it was not far off!! I watched as a
rotating lowering began to extend from the wall cloud.
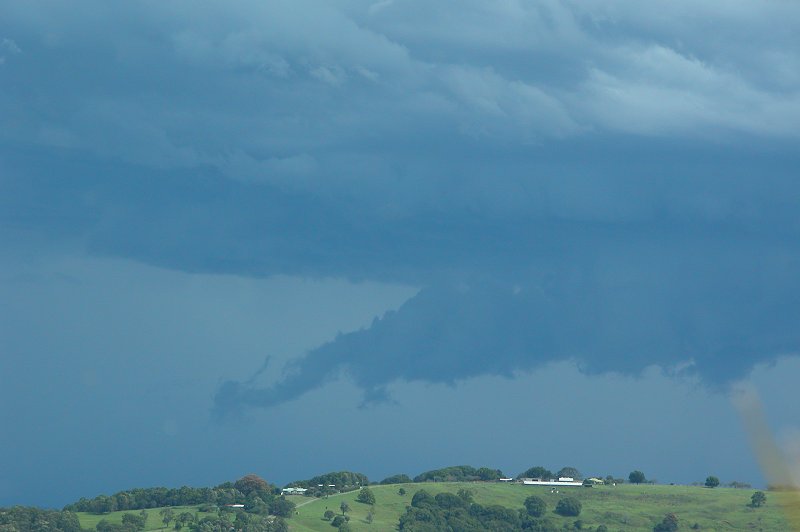
My eyes were glued to the funnel as it continued to extend from the wall cloud....would
it touch down? It wasn't to be. It soon began to lose the rotation in the
funnel, and it became some strange sort of lowering. I received a report from
Wardell that someone had seen a funnel almost touch down, which confirmed
what I had been observing.

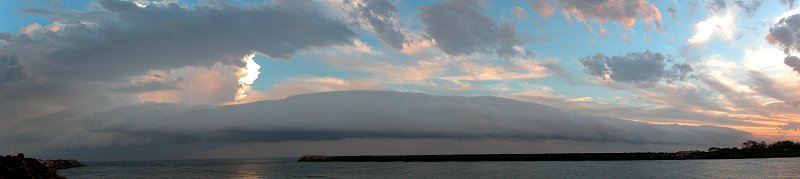
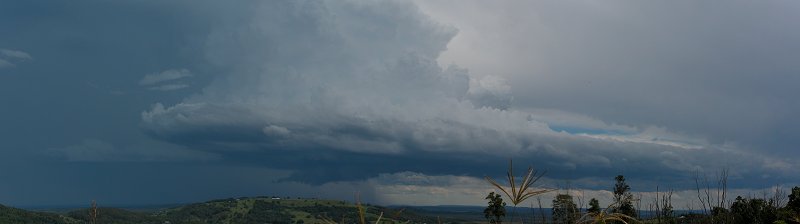
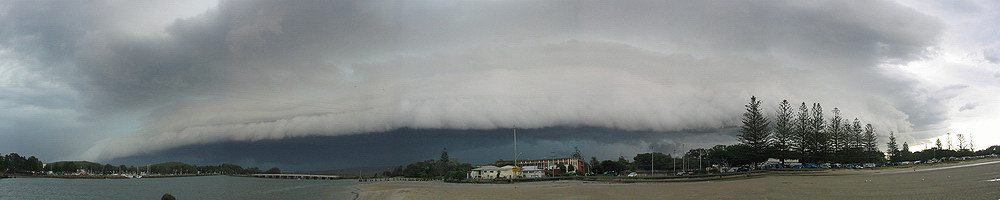
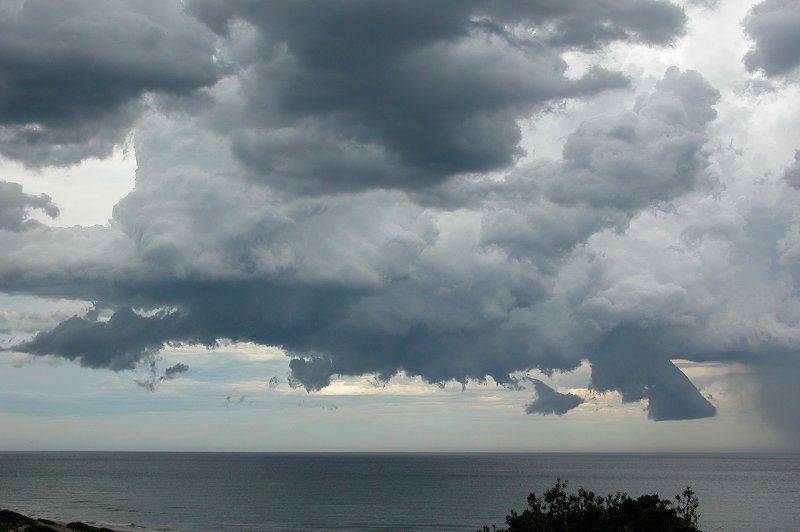
I was later to discover that the view from Evans Head was even more spectacular,
with a very large gustfront and amazing green tinge preceding what was to be a
severe hailstorm. The following panorama was taken by Isaac Smith near the Evans
River looking towards the western sky.
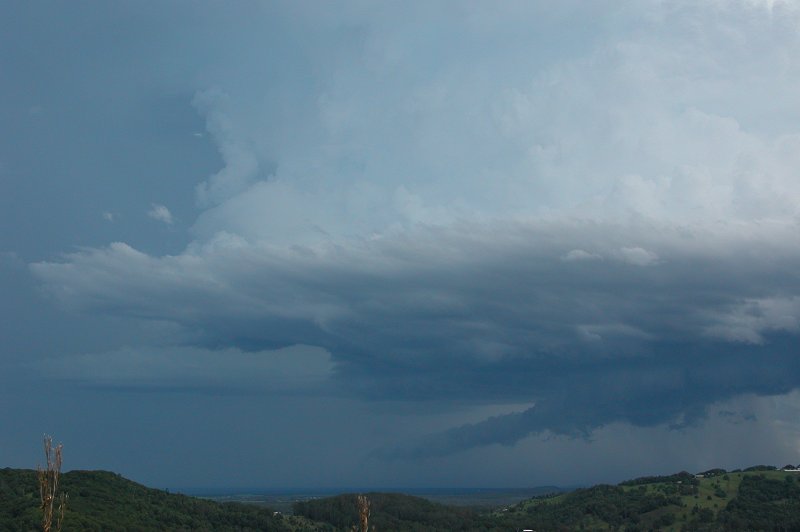
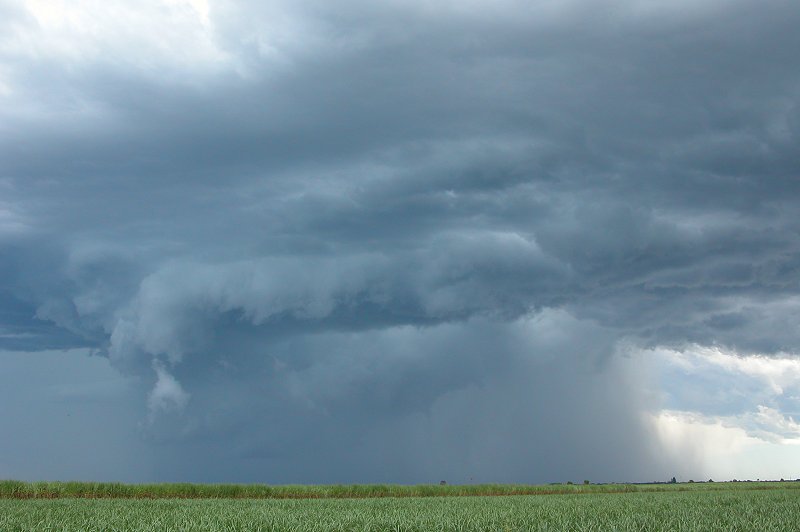
It was now about 3.25pm and I decided I'd stay a little longer to observe
the supercell rather than trying to get closer and possibly miss any further
funnel development. Updraft rotation remained strong, and it was clear now,
looking at the rainshaft in the outflow region, that somewhere near Evans
Head would be copping a large amount of hail! A couple of tiny funnels protruded
from underneath the wall cloud, but were very short lived. Several pulsating
CGs jumped out of the updraft region into clear air behind the storm.
At 3.30pm when it wasn't looking like another funnel was going to form so
I headed south to get closer and hopefully find some hail. The trip to Evans
Head was frustrating, being treed in for the first half. Especially when this
was all you could see....

I was soon on the Pacific Highway which has great clearings on its eastern
side, so watching the storm wasn't a problem. It did appear to have lost it's
nice supercell structure though. Some more pulsating CGs were observed on
the trip south to Evans Head.
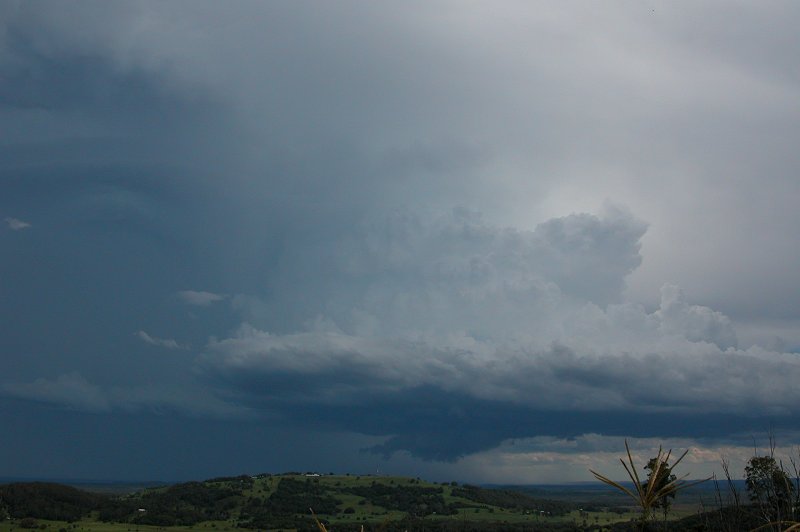
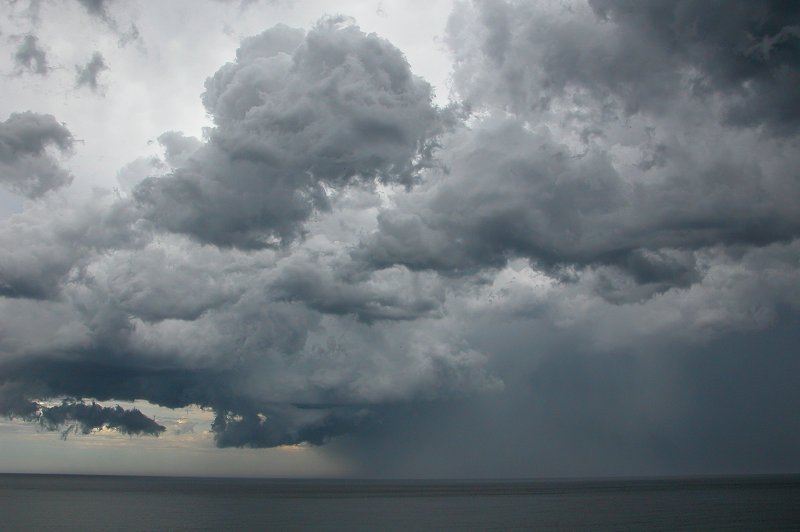
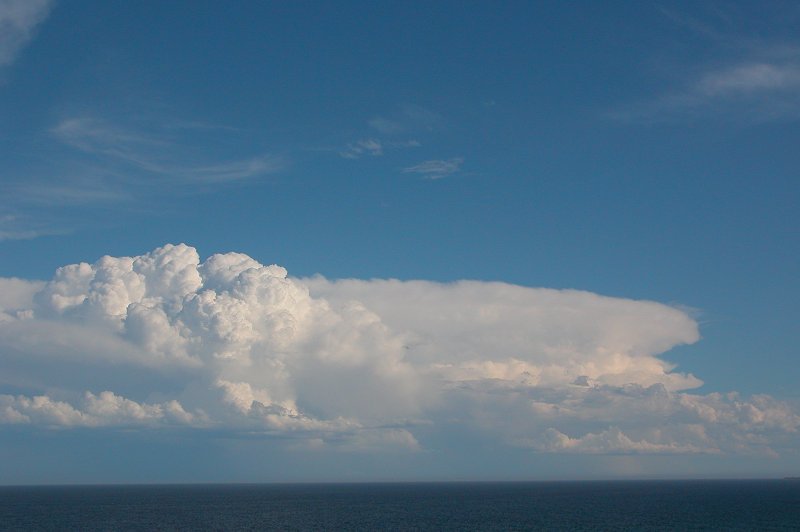
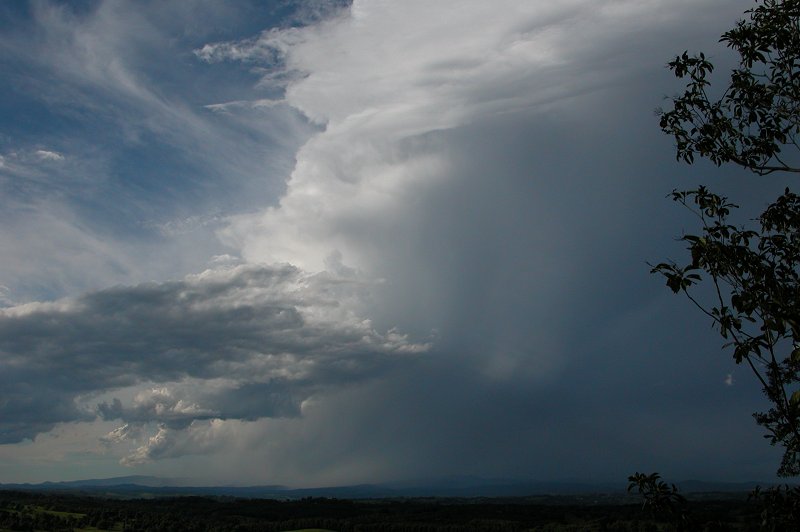
About 3.50pm I stopped at the Broadwater National Park lookout to get some
photos of the cell which was now out to see (it sure was fast moving!). It
had some strange structure on it, but nothing really exciting. Another weak
cell had formed behind it and was almost overhead, giving some thunder, but
no precipitation. I decided to keep heading to Evans and find some hail!
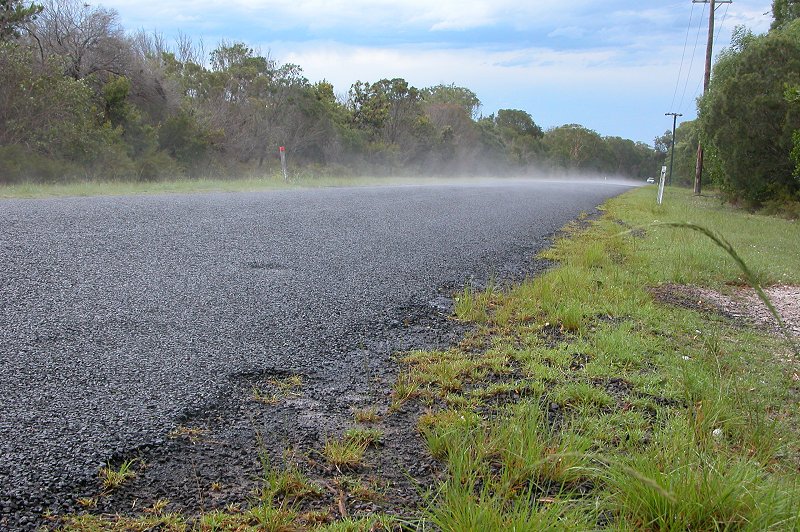
At 4.12pm, just after receiving a report of large hail at Evans Head, I came
across fog over the road!! Every storm chaser knows what that means! So I
quickly pulled over!
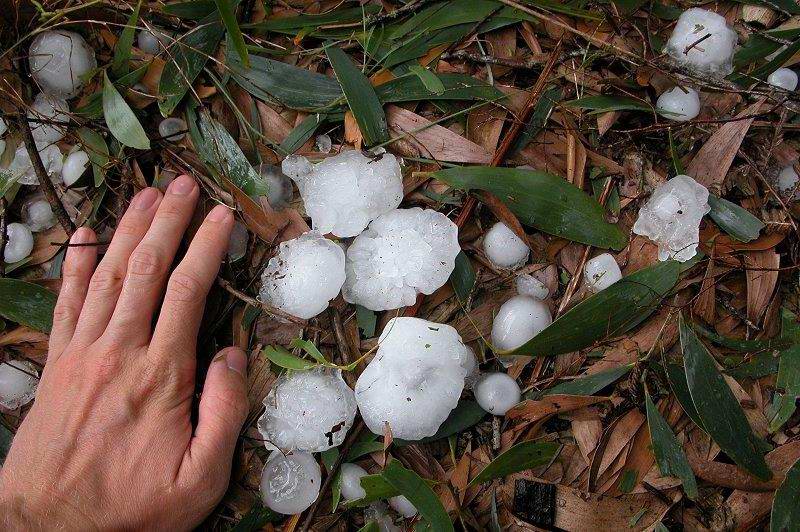
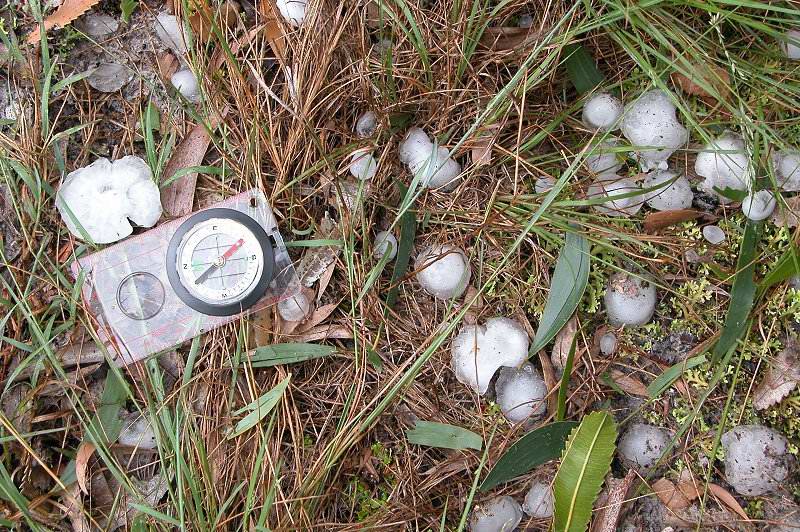
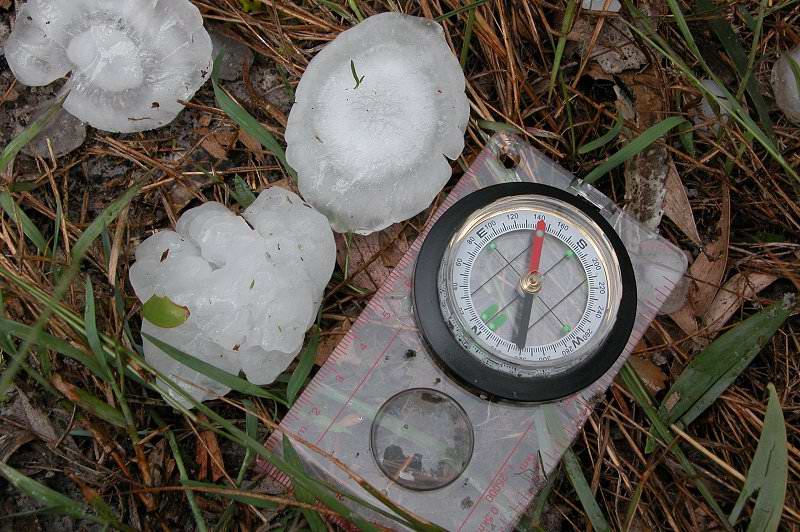
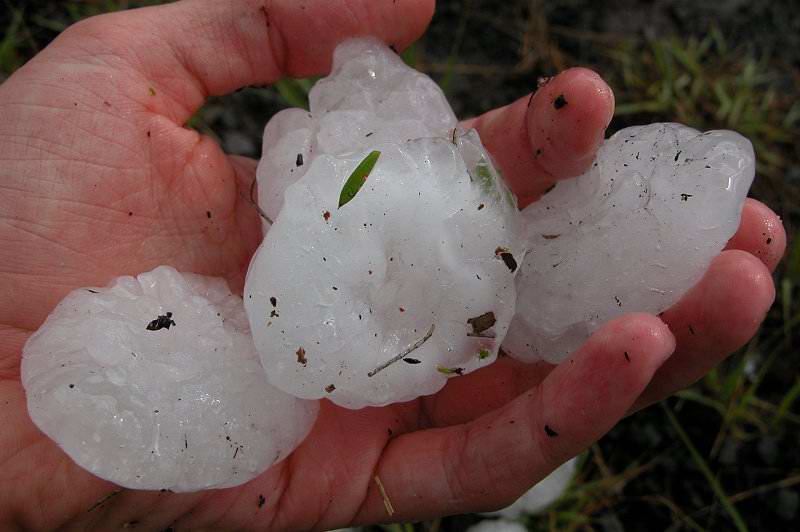
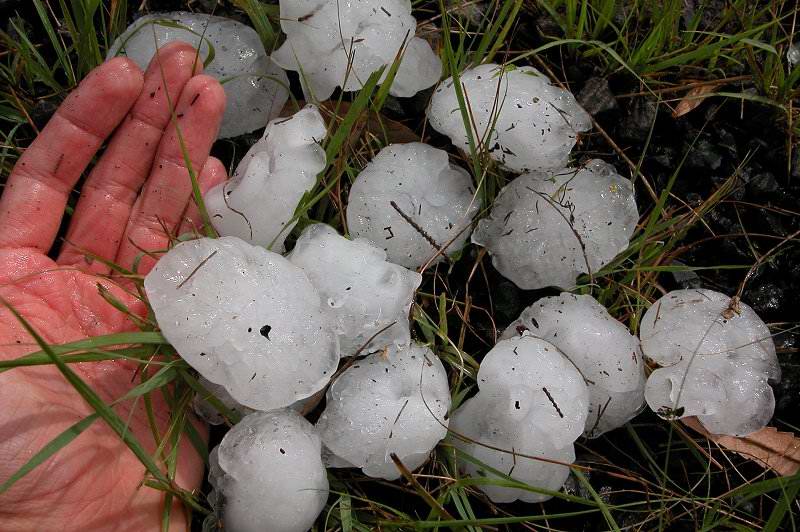
There were quite a few hailstones....and they were big!! It had been about
40 minutes since it had fallen and the biggest stone I measured was 6cm in
diameter. I imagine 7cm hail is likely to have fallen from this storm. There
were quite a few 5cm stones, with the average hail size probably about 3cm.
It was the biggest hail I had held in my hand since the January 17th Casino
supercell in 2001 (although obviously the largest stone in the Casino supercell
was much bigger than any produced by this supercell), so it was pretty exciting
see!

I headed into Evans Head at 4.30pm after playing around in the hail on the
northern outskirts of the town. I couldn't find any hail in town, though a
resident that lived on the southern side of the town said they got hail about
4cm in diameter. There was however evidence of large hail, with trees shredded
by the stones and a few small branches down. I noticed a couple of parked
cars with small dents, however it is impossible to tell if this is the result
of the hail that had just fallen. I didn't see any smashed windows while driving
down the main street of Evans Head. I headed up to a lookout on the southern
side of town to observe a cell that was down near Grafton. It would have been
interceptable had it not been going east! So I watched it slide past to my
S at 4.55pm before heading back home.

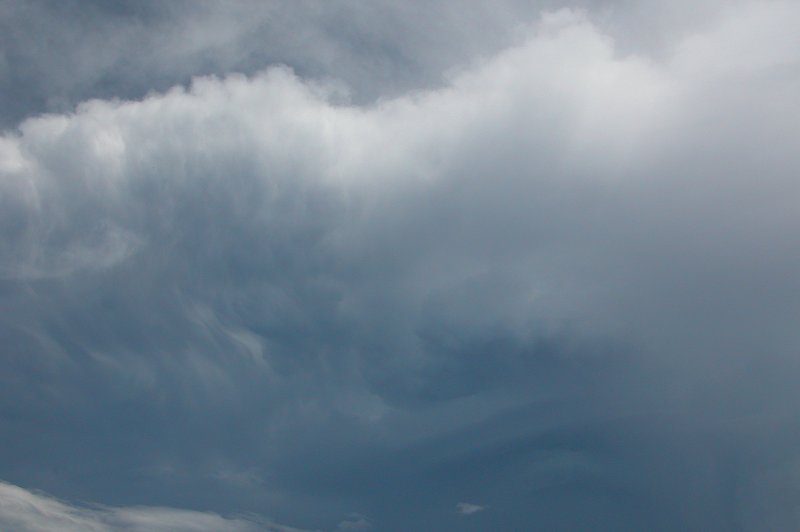
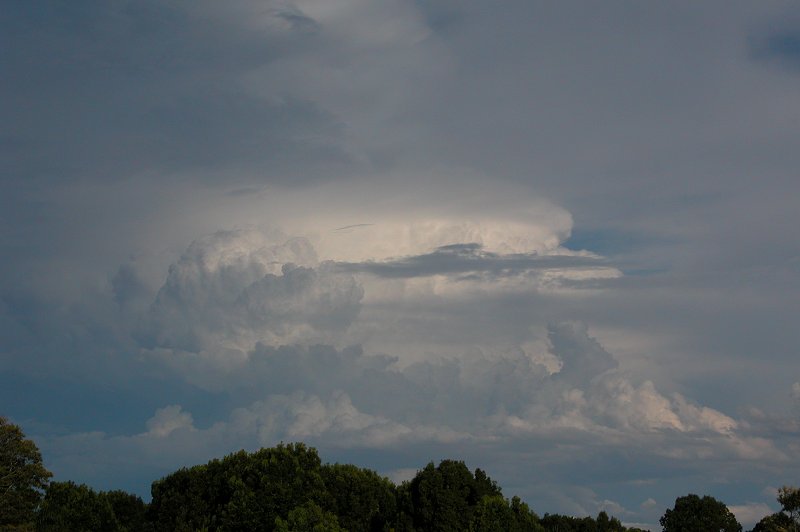
I stopped briefly back at the Broadwater lookout at 5.15pm to get some photos
of the cell to my east and those to my south. Storms really exploded once
they got offshore.

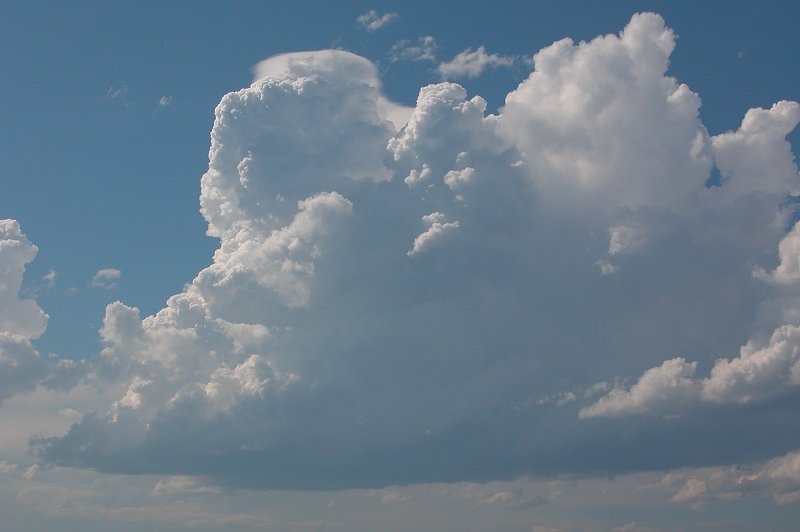
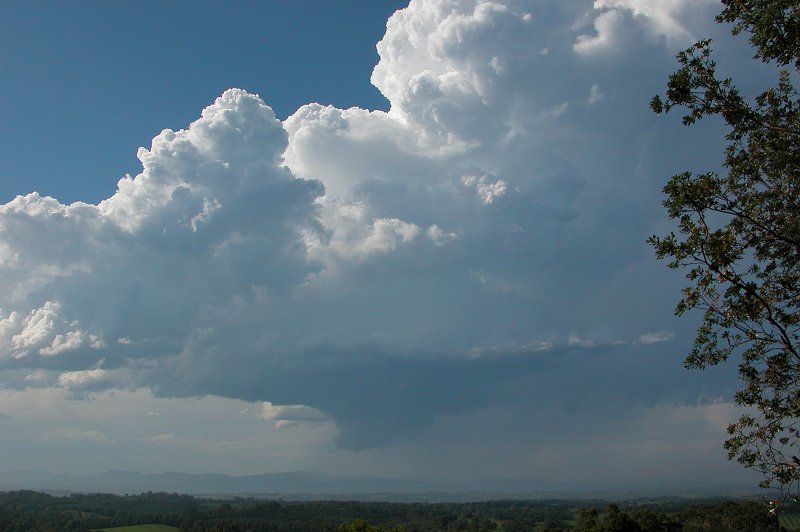
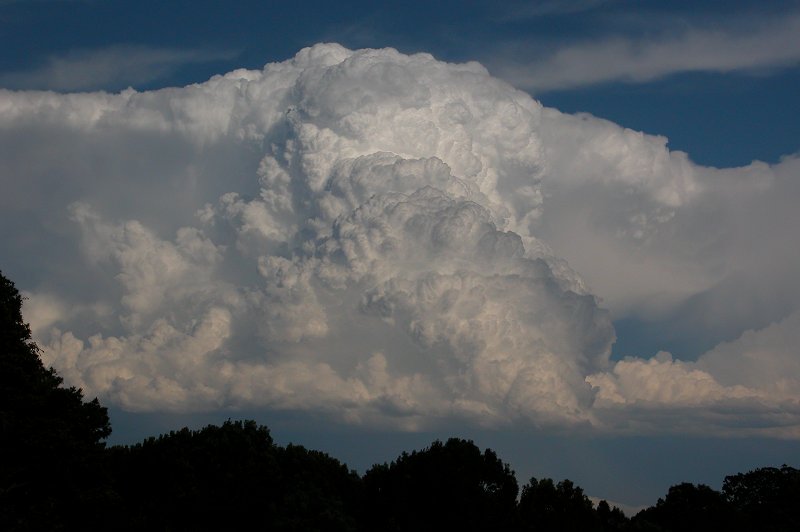
This photo taken at 5.20pm on the trip back home looked a little like a volcanic
eruption! Nice crisp updrafts, although the contrast was poor with so much
anvil cloud around.
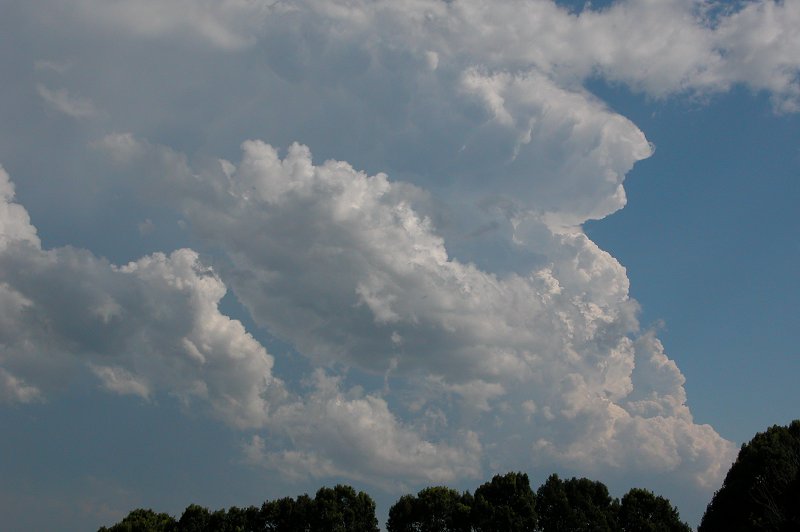
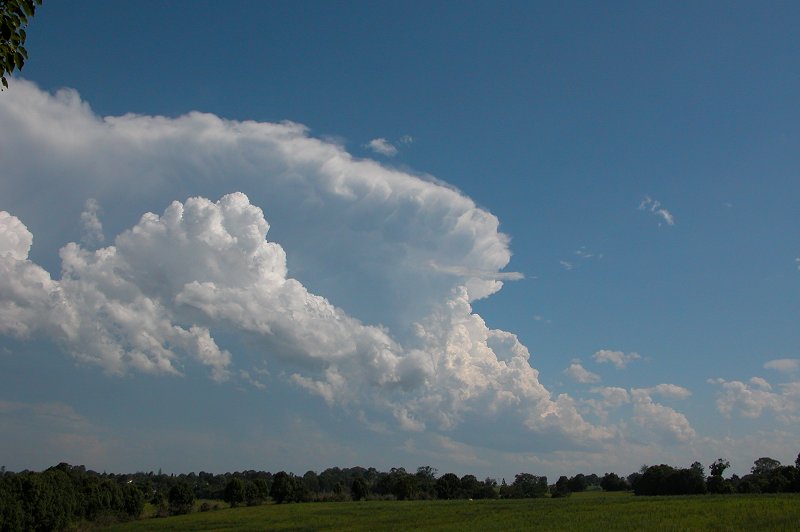
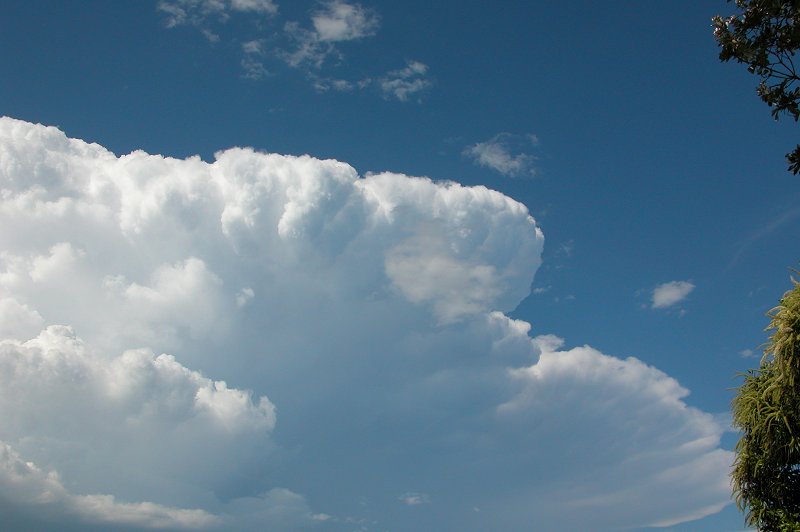
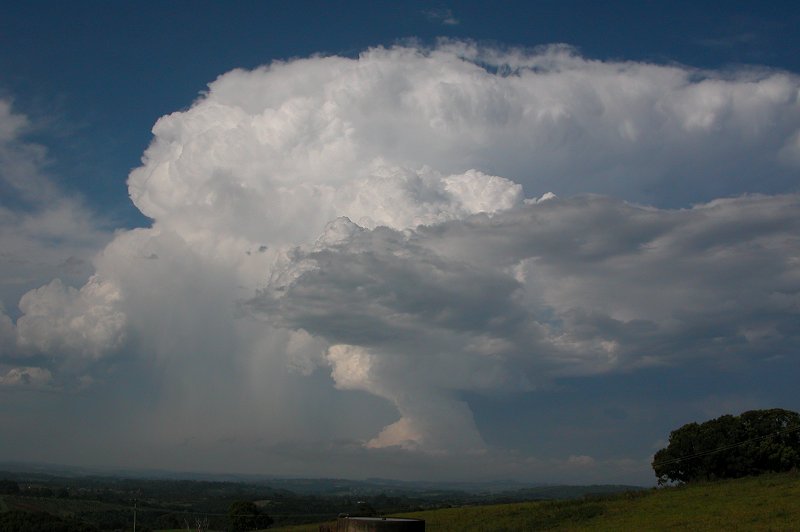
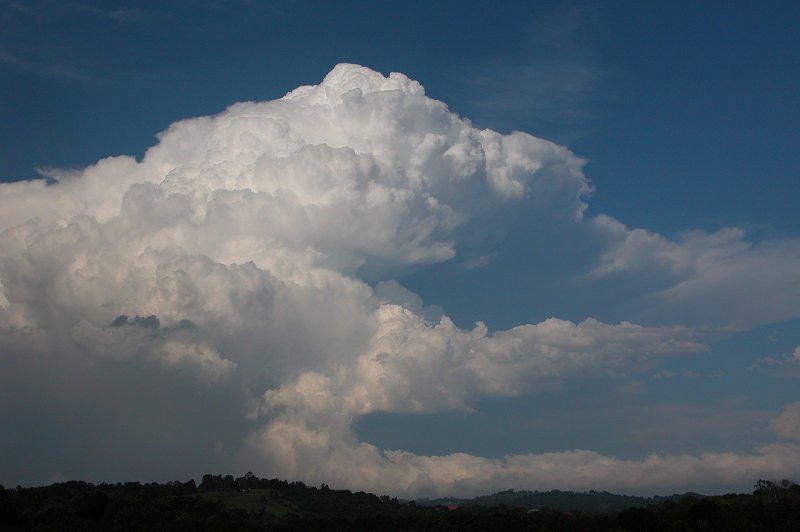
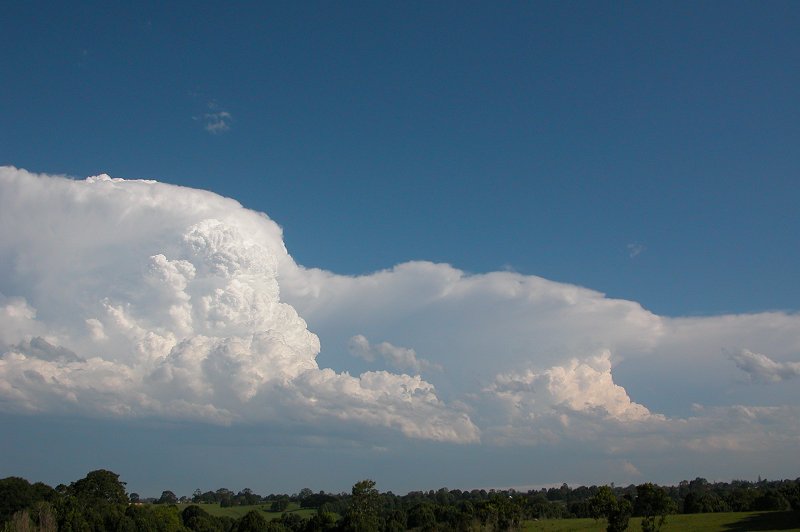
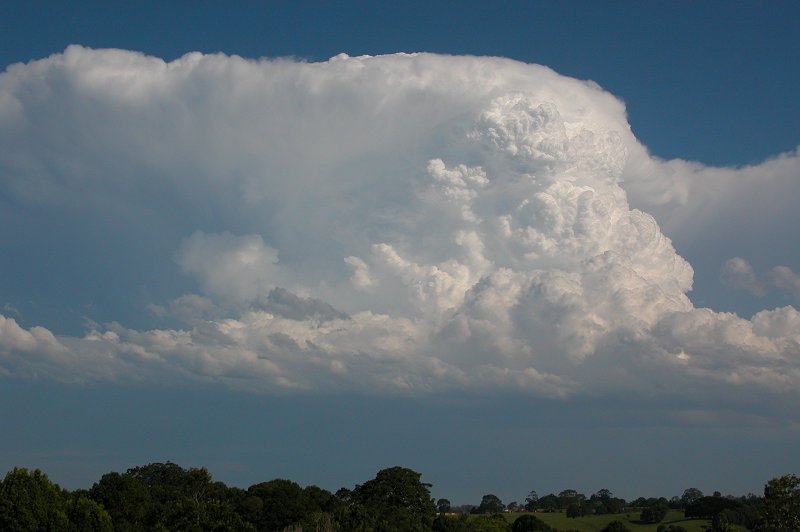
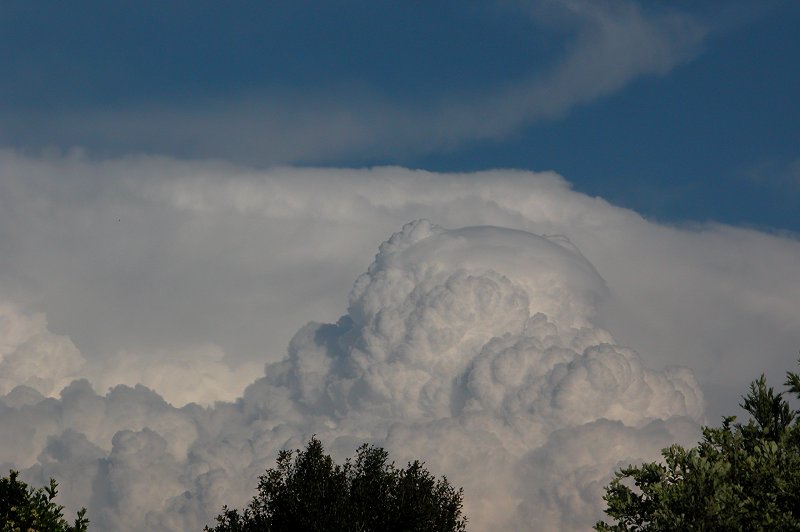
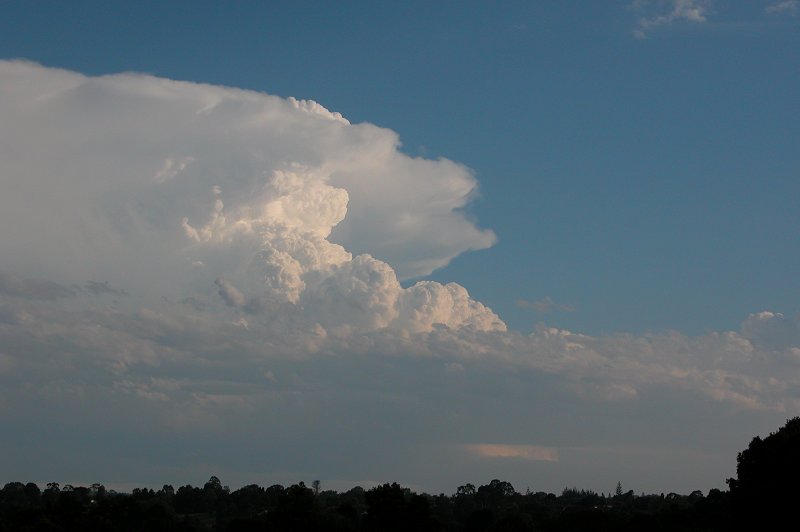
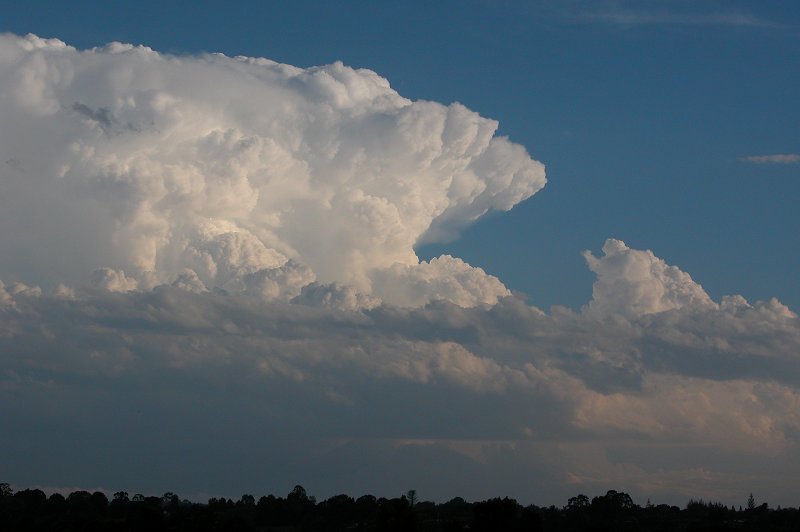
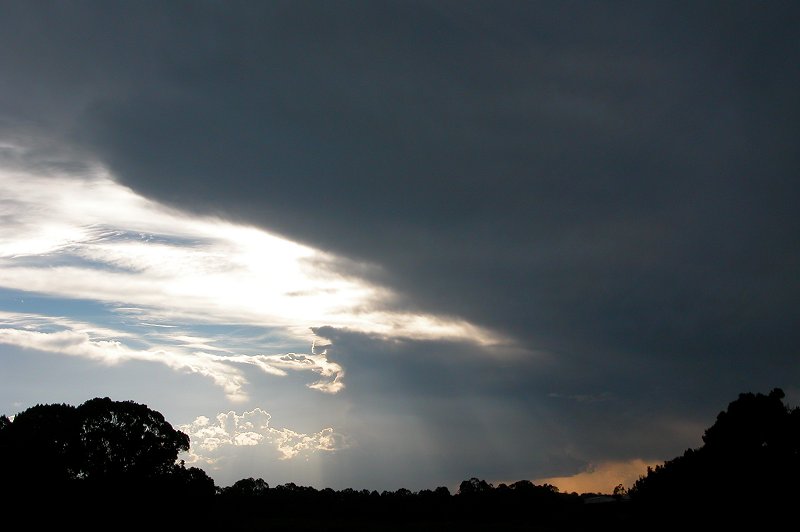
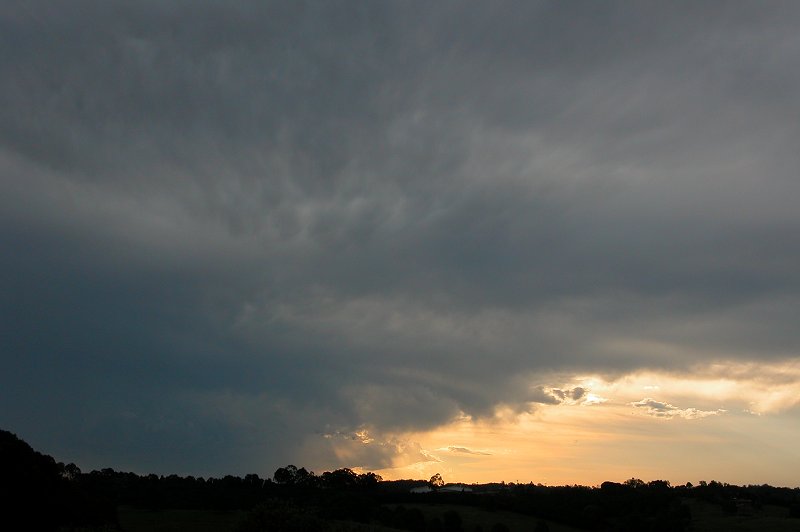
The following images were taken at 5.50pm when I arrived home of a nice strong
cell to the NNW that Michael had been observing while I was out. Hopefully
he can put some photos and timelapse that he took online. The last photo in
the sequence is of the big storm that was way off to the east, again having
nice solid updrafts.


All the activity cleared out after this. So that was the end of nine days
of storms! The last day of the outbreak was definitely the highlight, but
each day had provided something different. What an awesome opportunity to
get out and do some serious chasing! It definitely made up for the more than
average summer chase season we had experienced up until this outbreak.
From Bureau of Meteorology.
From Bureau of Meteorology:
00z to 12z animation 28/1/2004
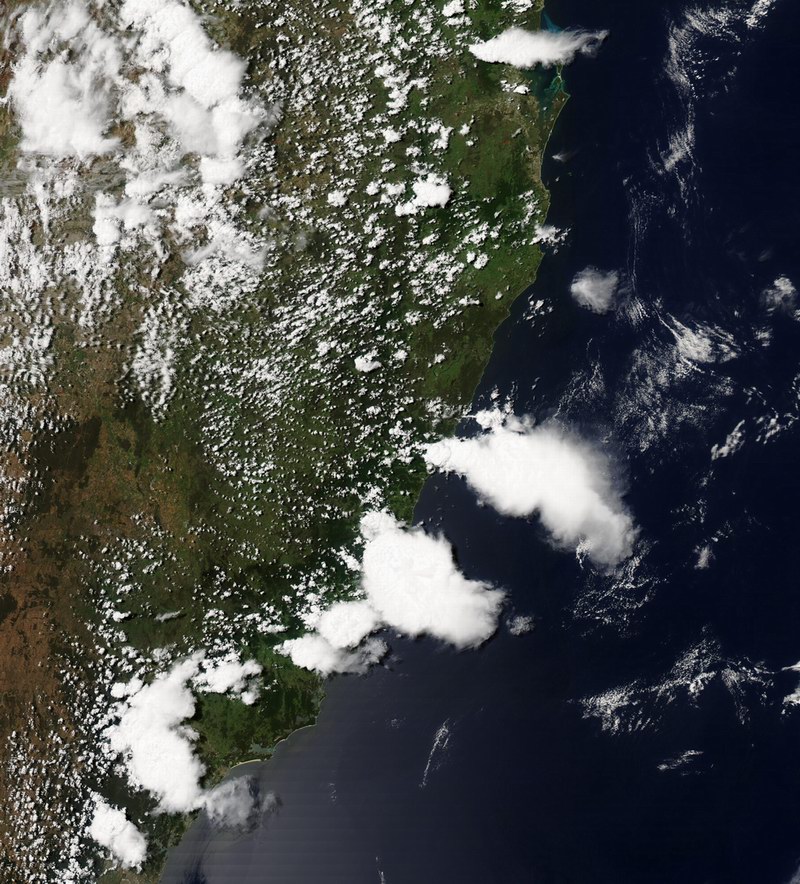
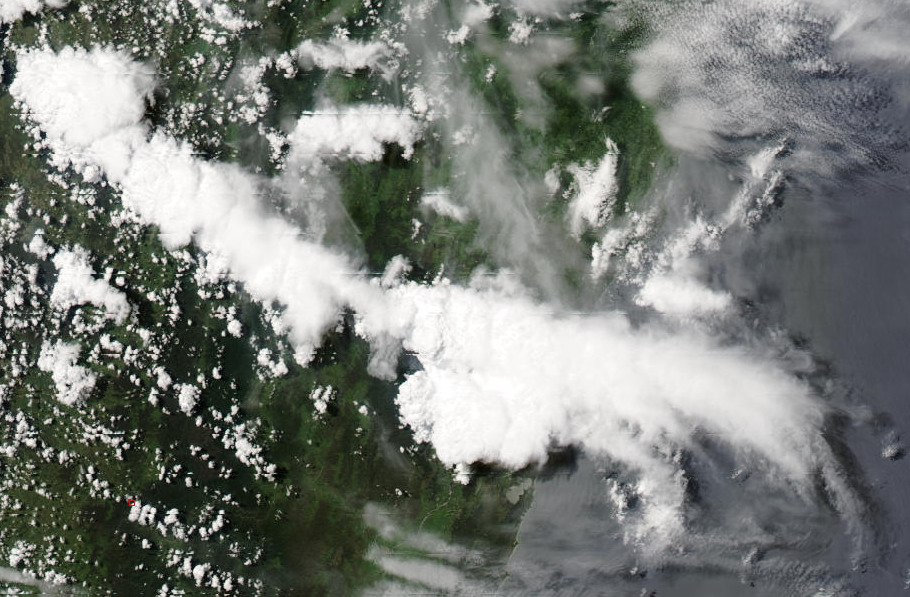
From MODIS: Land Rapid Response System:
00z to 12z animation 29/1/2004
00z to 12z animation 30/1/2004
From Bureau
of Meteorology.
From NOAA 28/01/2004 06z analysis run
From NOAA 29/01/2004 06z analysis run
From NOAA 30/01/2004 06z analysis run
Report compiled by Dave Ellem and Michael Bath
|
Document: 200401-03.htm
Updated: 22nd April, 2004 |
[Australian Severe Weather index] [Copyright Notice] [Email Contacts] [Search This Site] |