[Index]
Tropical Cyclones: Plotting Information
| Tropical
Cyclones
[Index] |
Tropical Cyclones: Plotting Information |
Cyclones are generally only included if the track commenced or moved into the Australian tropical cyclone warning areas (between 90 and 160 degrees East).
A listing of BoM data is available and includes all cyclones from 1907 to June 2005. Historical data is reviewed once updated best track data becomes available.
Australian Region: 90E to 180E (this is a best fit region and not an official TC basin)
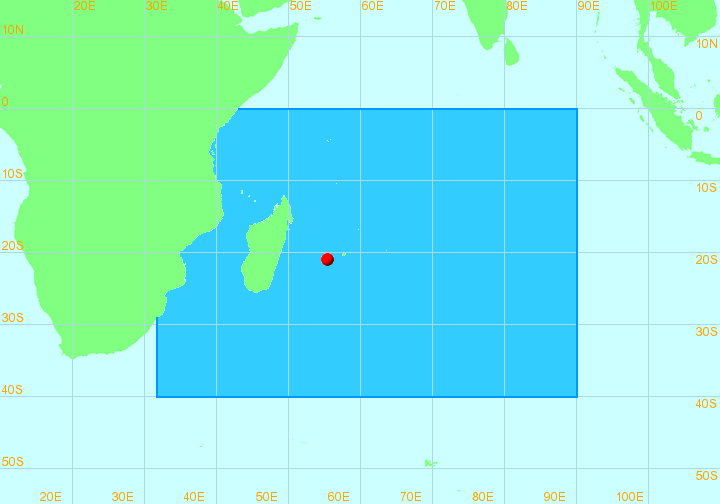
South Indian Ocean (SIO): 15E to 135E
South Pacific Ocean (SPAC): 135E to 110W
A listing of JTWC data is available and includes all cyclones from 1945 to June 2004.
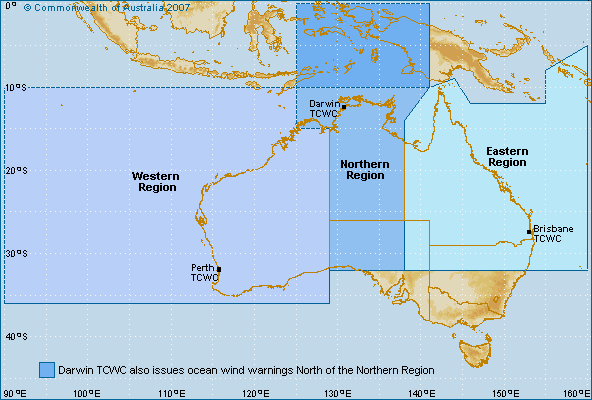
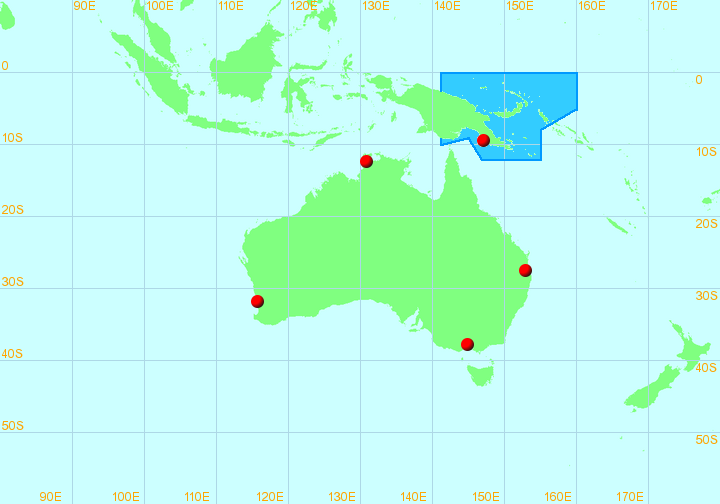
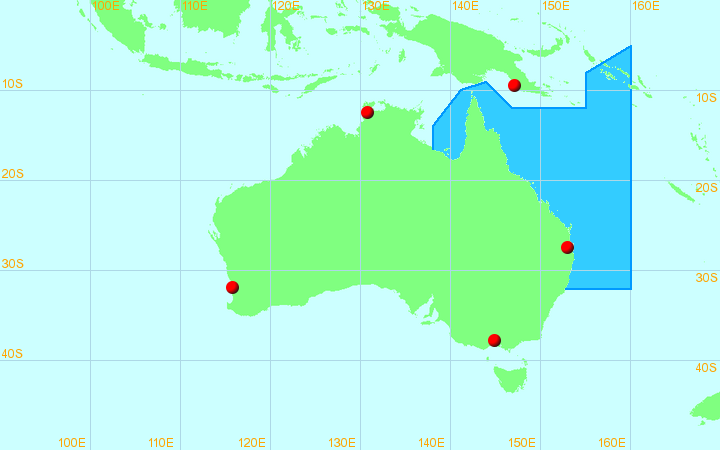
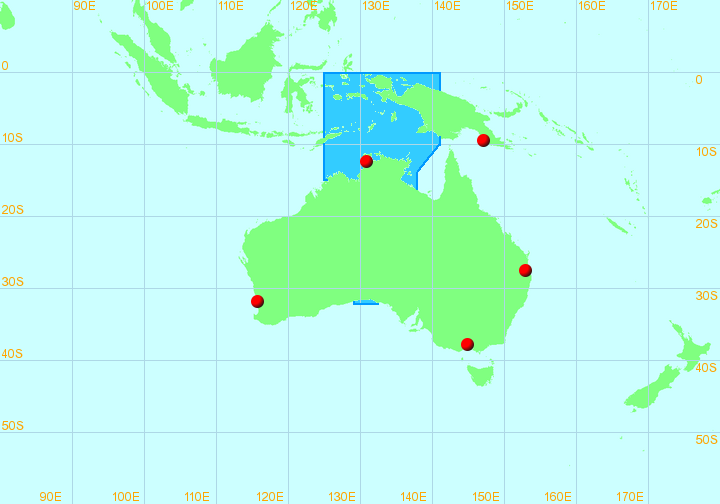
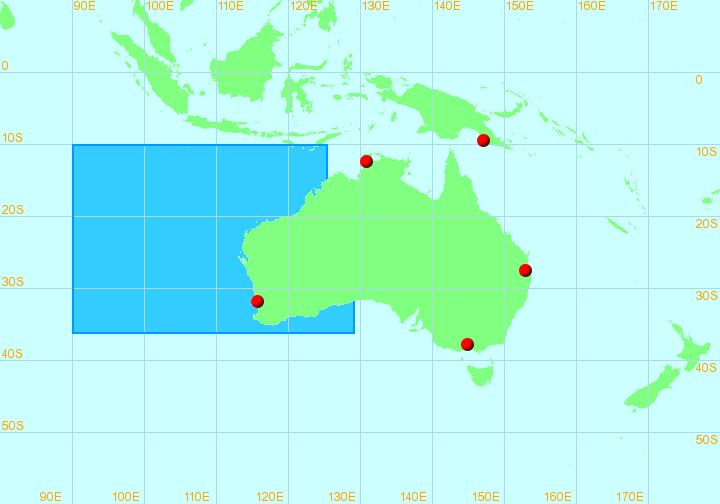
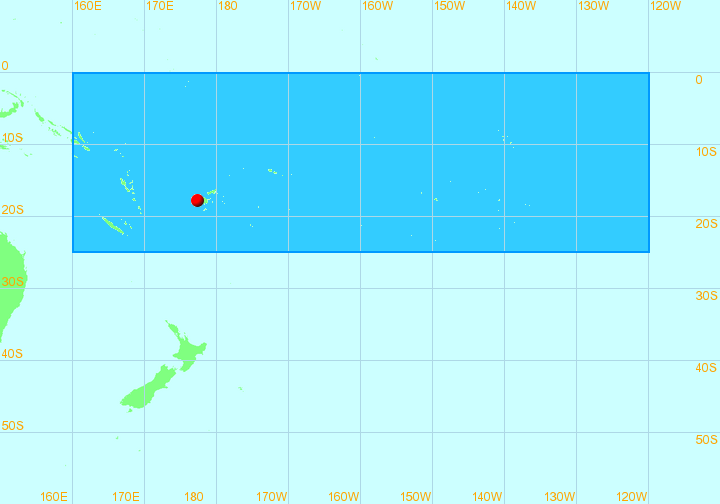
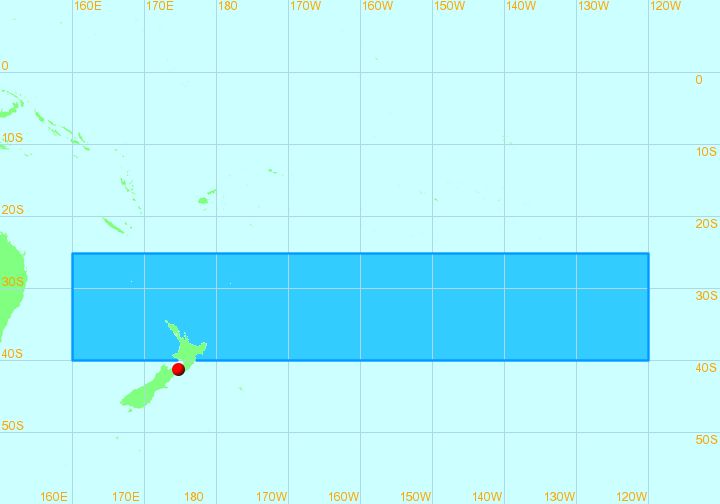
The following maps from the World Meteorological Organization show the official warning centres of the Southern Hemisphere.
TCWC-Port Moresby/Papua New Guinea
TCWC-Brisbane/Australia
TCWC-Darwin/Australia
TCWC-Perth/Australia
RSMC Nadi-Tropical Cyclone Centre/Fiji
TCWC-Wellington/New Zealand
La Reunion-Tropical Cyclone Centre/Meteo-France
The plotting software (U.S based) displays this key on all maps. The term "Typhoon/Hurricane" should read "Tropical Cyclone". The dates on individual TC track maps are mm/dd format. The Southern Hemisphere Tropical Cyclone classification system is defined in the table below. The Hurricane and Typhoon classification systems are different.
| Storm Type | Pressure (mb) | Max Gust (km/h) | 10-min Ave Gust (km/h) | Dvorak Rating | Effects during landfall |
|---|---|---|---|---|---|
| Tropical Depression | >= 1000 | < 52 | 2.0 | ||
| Tropical Storm | 996 - 999 | 52 - 62 | 2.5 | ||
| Category 1 Tropical Cyclone | 986 - 995 | < 125 | 63 - 90 | 3.0 - 3.5 | Negligible house damage. Damage to some crops, trees and caravans. |
| Category 2 Tropical Cyclone | 971 - 985 | 125 - 169 | 90 - 125 | 4.0 - 4.5 | Minor house damage. Significant damage to signs, trees and caravans. Heavy damage to some crops. Risk of power failure. Small craft may break moorings. |
| Category 3 Tropical Cyclone | 956 - 970 | 170 - 224 | 125 - 165 | 5.0 - 5.5 | Some roof and structural damage. Some caravans destroyed. Power failures likely. |
| Category 4 Tropical Cyclone | 930 - 955 | 225 - 279 | 165 - 225 | 6.0 - 7.0 | Significant roofing loss and structural damage. Many caravans destroyed and blown away. Dangerous airbourne debris. Widespread power failures. |
| Category 5 Tropical Cyclone | <= 929 | > 280 | > 225 | 7.5 - 8.0 | Extremely dangerous with widespread destruction. |
|
Document: information.htm
Updated: 3rd May 2006 |
[Australian Severe Weather index] [Copyright Notice] [Email Contacts] [Search This Site] |