and Chasing
[Index][Archives]
NSW Northern Tablelands Snow Chase Forecasting Guide
by Michael Bath
| Storm News and Chasing [Index][Archives] |
NSW Northern Tablelands Snow Chase Forecasting Guide by Michael Bath |
This information is aimed at those who reside in the NSW weather districts of Northern Tablelands, Northern Rivers, northern half of the Mid North Coast, the Northwest Slopes and Plains, and also those in Southeast Queensland. The more southern and distant parts of the Northern Ranges including the Barrington Tops and Walcha are not discussed - although the forecasting tips presented on this page are valid for those areas and the Central Tablelands too.
Like the rest of mainland Australia outside the Alpine regions of Northeast Victoria and Southeast NSW, the Northern Ranges of NSW are a marginal location for snowfalls. As such, it is quite a novelty and challenge for weather enthusiasts and snow chasers to see snow falling, or to come across decent accumulations of snow.
Non-alpine snow is possible in Southeast Australia any time of the year but of course it is much more likely in the coldest months with the shortest amount of daylight: May through August.
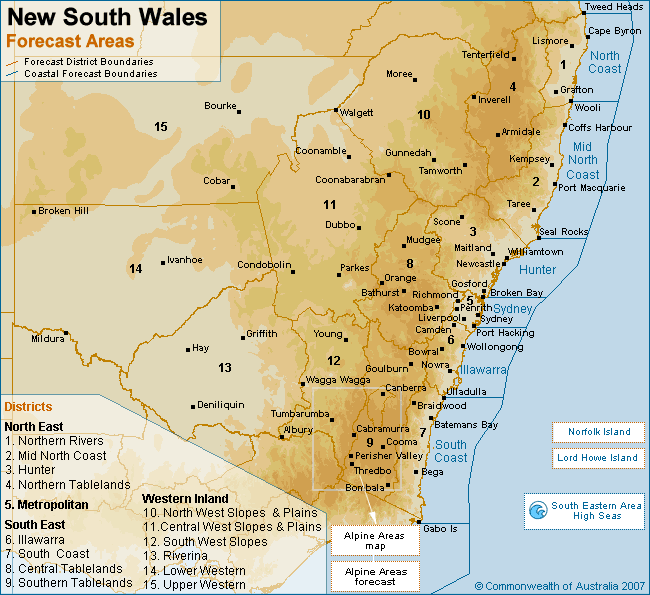
The Northern Ranges of the Great Dividing Range can be seen in this map courtesy of Andrew Miskelly. It includes the Barrington Tops west of Gloucester, the Nandewar Ranges (Mount Kaputar) east of Narrabri, all of the Northern Tablelands district from around Walcha to Tenterfield, and over the border into the Granite Belt district of Queensland. Some western parts of the Mid North Coast and the Upper Hunter are also part of the Northern Ranges.
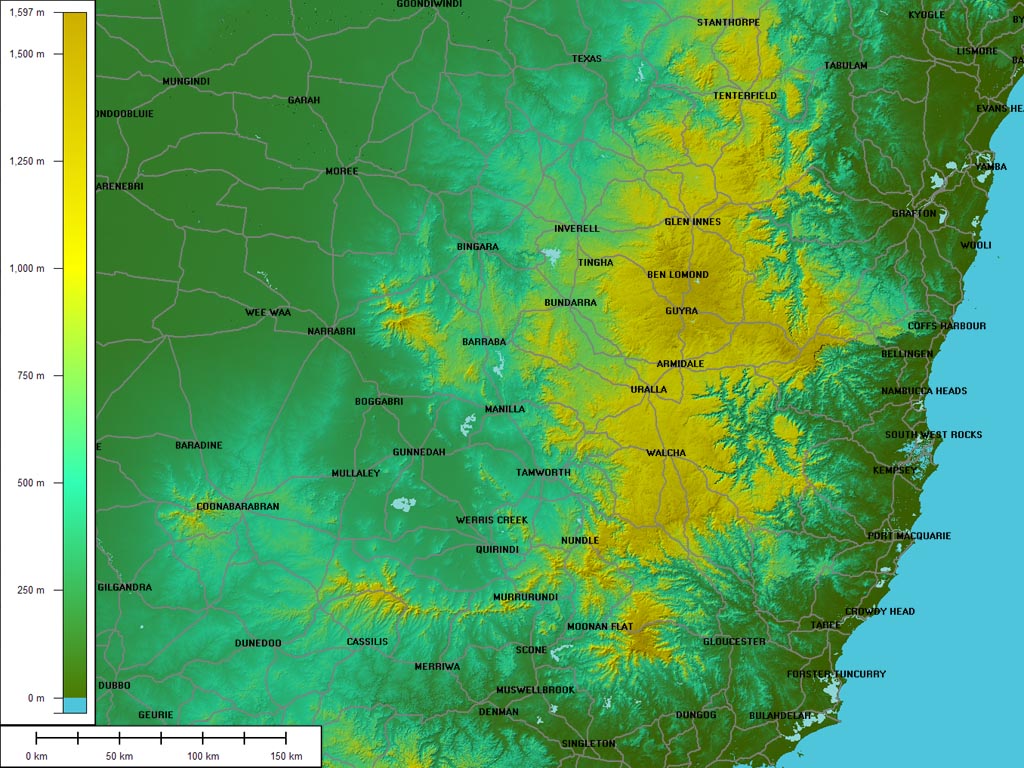
The most common areas to see snowfalls are at Mt Kaputar in the North West Slopes, and around Black Mountain, Guyra and Ben Lomond in the Northern Tablelands. There is no surprise why: those areas have plenty of terrain above 1,300 metres elevation. The higher the terrain, the better the chance of getting low enough temperatures for snow. Temperatures typically fall about 7-8 degrees C per 1,000 metres of elevation although this varies depending on how moist or dry the air is. This is referred to as the lapse rate.
Temperatures are regularly cold enough for snow throughout the Northern Ranges, but getting ample moisture to coincide with the cold temperatures requires certain weather setups that can be quite uncommon. Most snow events are of fairly short duration.
Significant cold fronts crossing the southeast of the country can produce snowfalls on the Northern Ranges but often the moisture is depleted by the time it reaches the lower latitudes. A high pressure system is normally following the passage of a cold front and this itself will lift the freezing level: 850hPa temperature height is higher than with lower pressure events. These setups are easier to forecast but quite often produce only light snowfalls. Orographic effect plays a big role in where the snow will fall on the Northern Ranges. The high country in NE VIC and SE NSW receive the best snowfalls in these situations.
There are much better chances of snow for the Northern Ranges when a pool of very cold, and often unstable air, is driven north or northeast from the Southern Ocean west of Tasmania, across Western Victoria or Eastern South Australia, and over inland NSW before impacting the Northern Ranges. In these setups, the moisture in the upper low often remains largely intact as it has encountered no other significant elevated terrain - apart from the relatively small geographic area of high ground in the Warrumbungle Ranges west of Coonabarabran, and also Mt Kaputar. Cold pools are often associated with the development of East Coast Lows in the Tasman Sea which helps enhance the available moisture supply. Another advantage of cold pools is they move relatively slowly compared to vigorous cold fronts. 850hPa temperature heights will be lower because the air pressure is lower.
Skip down to the forecasting guide.
Autumn 2008 has already seen two major cold outbreaks across Southeast Australia. The first occurred during 26-28 April but this event did not bring enough moisture to the Northern Ranges. However, some brief light snow showers were reported from higher ground near Tamworth.
Australian Severe Weather Forum discussion of this event.
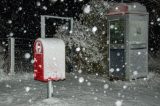
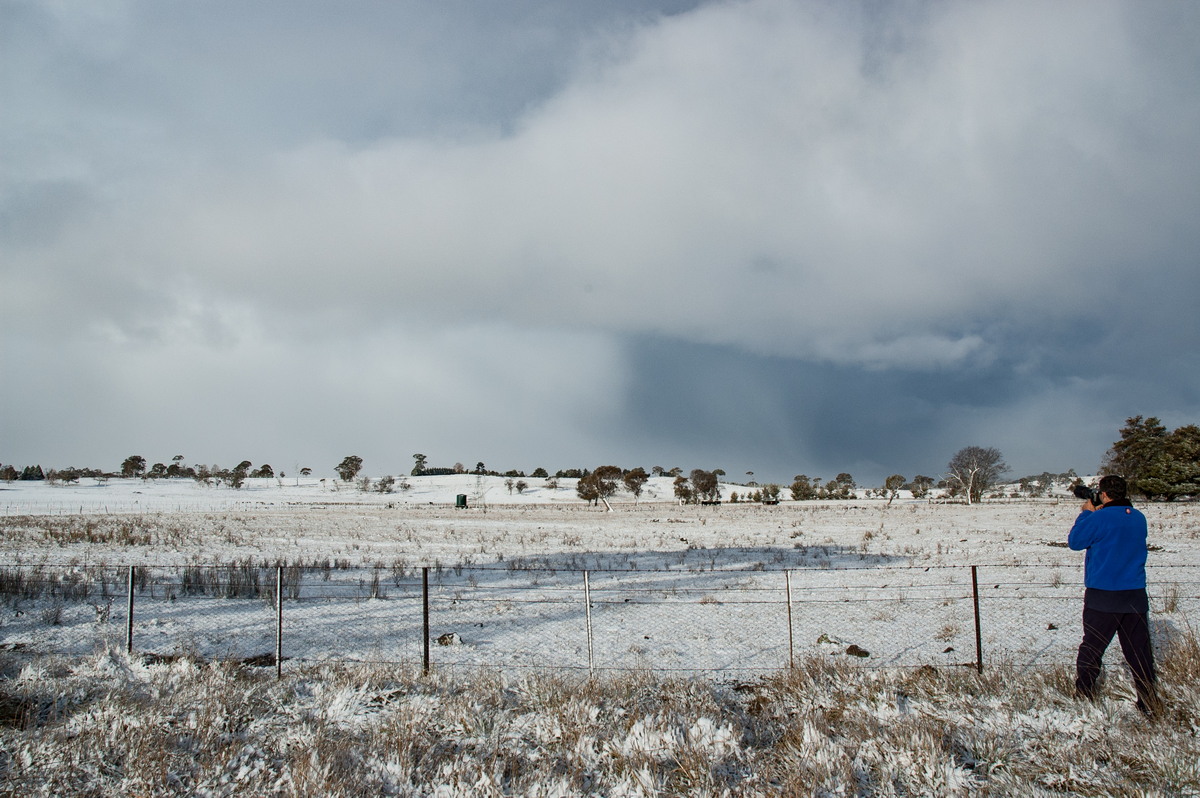
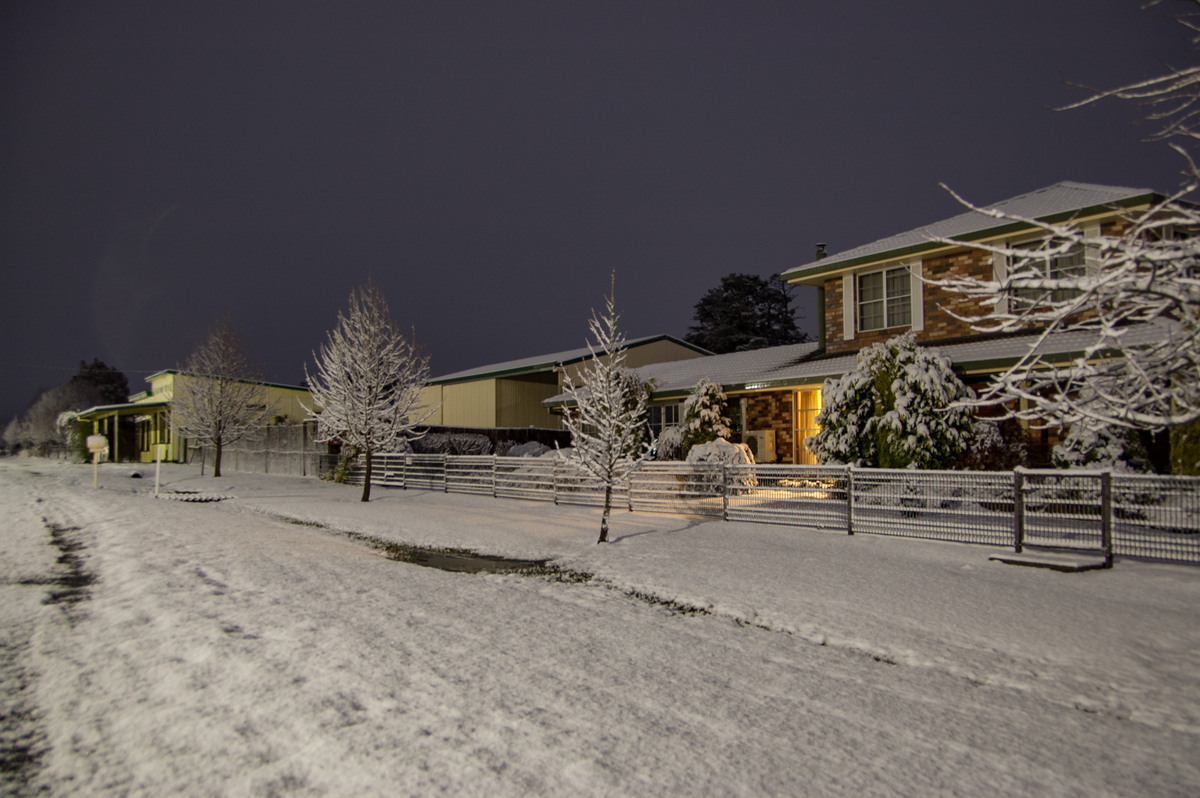
 Weather Pictures
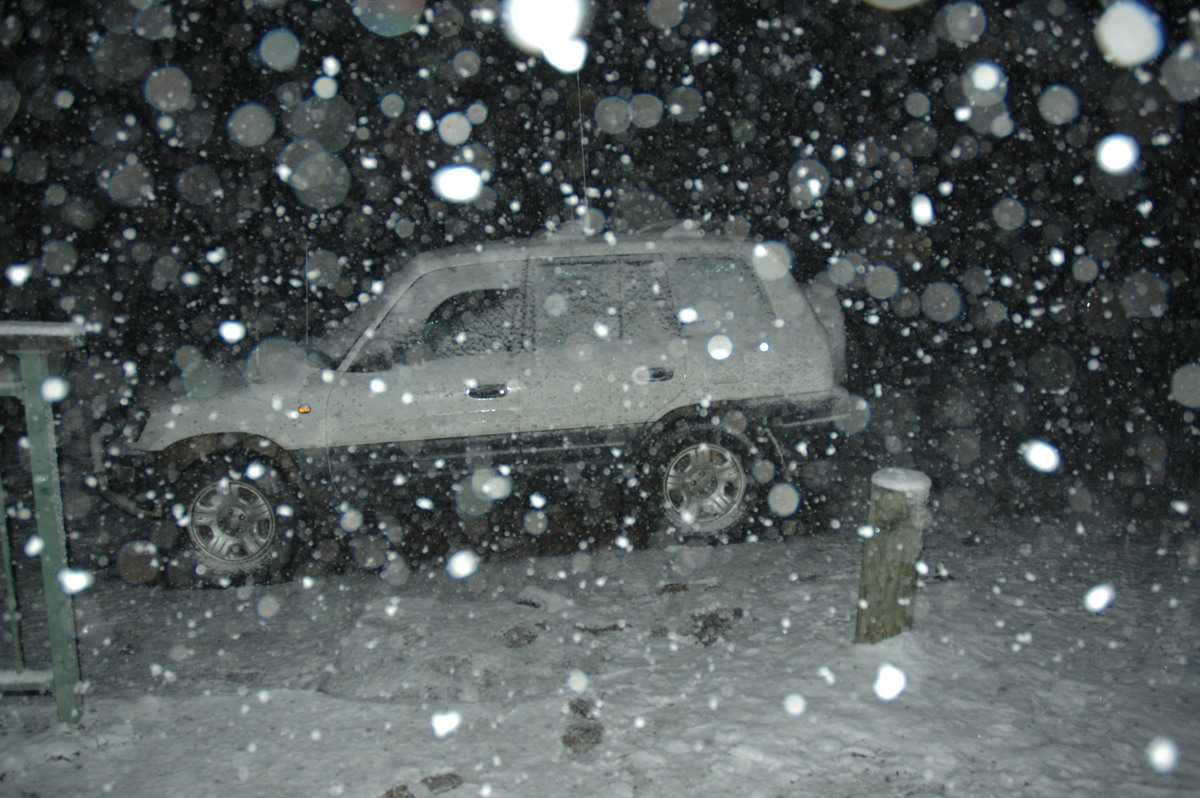
17th May 2008: [by Michael Bath] [by Rodney Wallbridge]
18th May 2008: [by Michael Bath] [by Rodney Wallbridge]
Links to: [Weather maps & satpics] [GFS output] [MLAPS output]
A strong cold front and associated pre-frontal trough passed over NSW during the 17th May 2008. Behind the front was a significant cold pool which was driven north-eastwards from Southeast South Australia towards the Northern Tablelands.
Widespread thunderstorms developed over Northeast NSW and Southeast Queensland during the afternoon and evening of 17th May in response to the pre-frontal trough.
A frontal cloud band with light to moderate rain advanced across the northern inland of NSW ahead of the cold pool. The timing of this cloud band was expected to produce light rain over the Northern Ranges because air cold enough to allow snow to reach ground level was not forecast to arrive until after midnight. Snow showers were expected to fall once 850hPa temps dropped below 2 C early am on the 18th but moisture was likely to be substantially depleted. Consequently, only a light cover of snow was expected to occur during the morning period over the Guyra to Ben Lomond region.
850hPa heights were about 1430 metres for the snow target.
Snowfalls commenced between Armidale and Glencoe about 9.30pm 17th May with heavy falls occurring between Black Mountain and Ben Lomond from 10pm to midnight. 6-7cm of dry powder snow covered all the higher terrain within that two hour period.
With 850hPa temps analysed at 3 to 5 C over the target area during that time, what allowed so much snow to fall?
 Moree
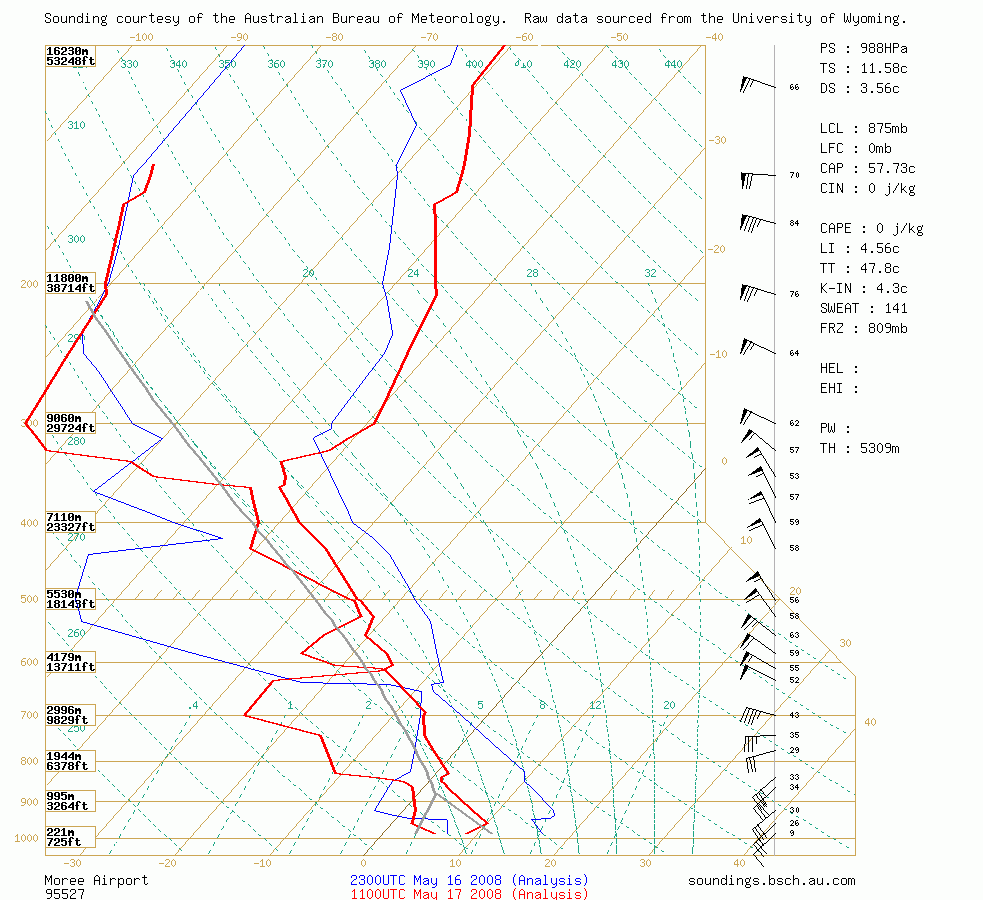
Sounding 10pm 17th May: The air was quite dry up to about 600hPa. The frontal cloud band was producing light to moderate precipitation from the 600 to 350hPa
level. Temperatures have cooled significantly over the previous 24 hours, but the freezing level is not achieved until about 820hPa, although temps around 1-2
C extend down to 860hPa.
Moree
Sounding 10pm 17th May: The air was quite dry up to about 600hPa. The frontal cloud band was producing light to moderate precipitation from the 600 to 350hPa
level. Temperatures have cooled significantly over the previous 24 hours, but the freezing level is not achieved until about 820hPa, although temps around 1-2
C extend down to 860hPa.
Heavy snow falling from the cloud band melted absorbing energy from the surrounding atmosphere: latent heat absorption. This allowed subsequent precipitation to remain as snow to lower and lower levels. The widespread nature of the cloud band gave sufficient time to allow the snow level to drop sufficiently over the Northern Tablelands.
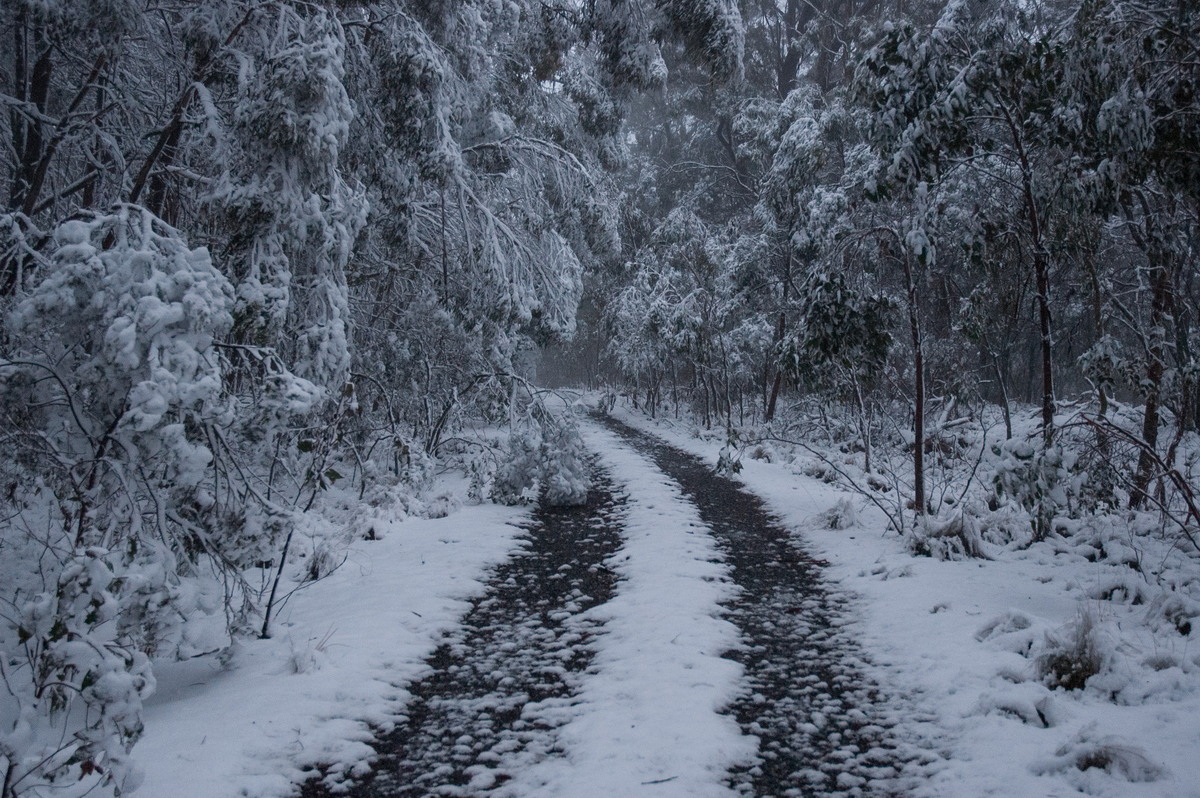
The thicker cloud and snow cleared by 12.30am 18th May. Thin stratocumulus cloud and no further precipitation occurred until sunrise. Between 7am and 10am orographically enhanced cloud thickened enough to produce frequent snow showers around Guyra and Ben Lomond. Snow was also observed at Mount Mackenzie (1285m) near Tenterfield. The temperature remained between zero and 1 during that period. After this time cloud cover became patchy and temperatures rose allowing most of the snow cover to melt by midday.
The Guyra Hospital Bureau of Meteorology observing site measured a 7cm snow cover at 9am.
Australian Severe Weather Forum discussion of this event.

 Weather Pictures
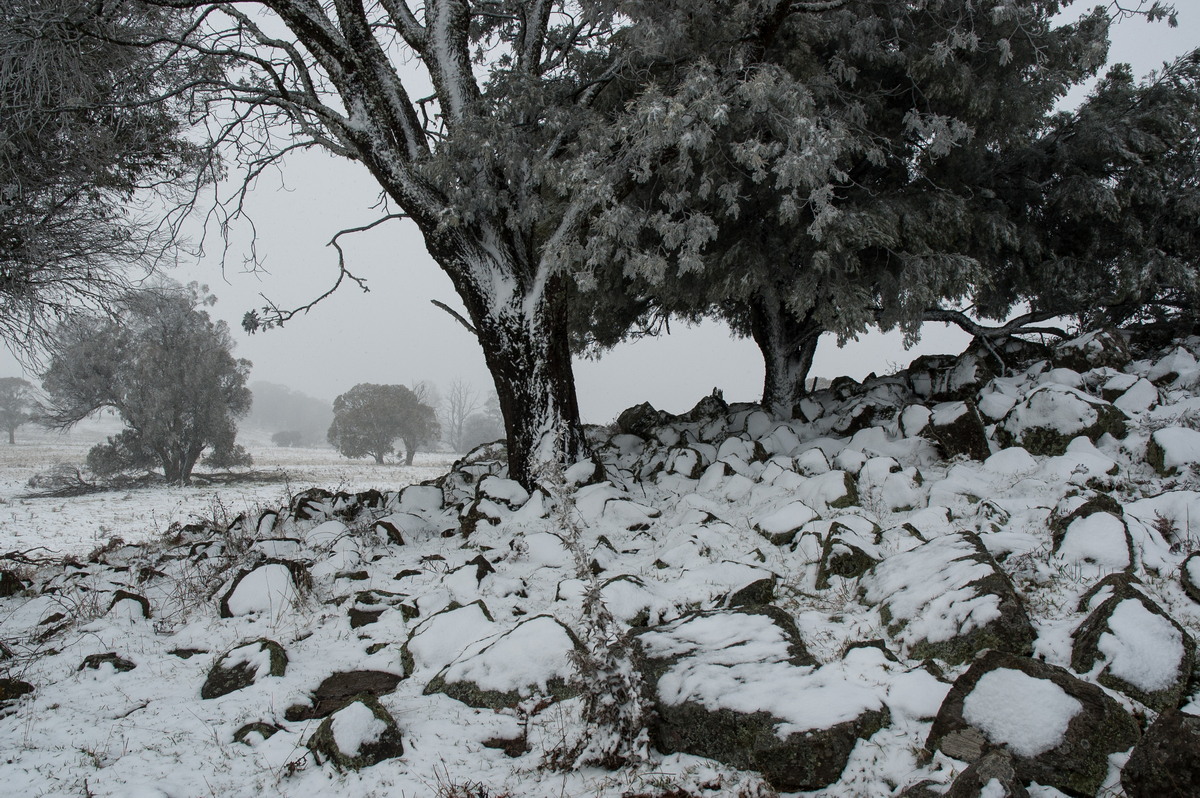
8th June 2007: [by Michael Bath] [by Rodney Wallbridge]
9th June 2007: [by Michael Bath] [by Rodney Wallbridge]
Links to: [Weather maps & satpics] [GFS output] [TWC output]
This was a prolonged severe East Coast Low event with cold pool. The setup saw a cold pool move north through western Victoria, Western NSW and into Southwest Queensland over a couple of days prior to the rapid intensification of a coastal low. This weather system dominated the entire state of NSW. As a result of the intensification of the low, the cold pool positioned over Southwest Queensland was dragged east then southeast right over the northern half of the Northern Tablelands.
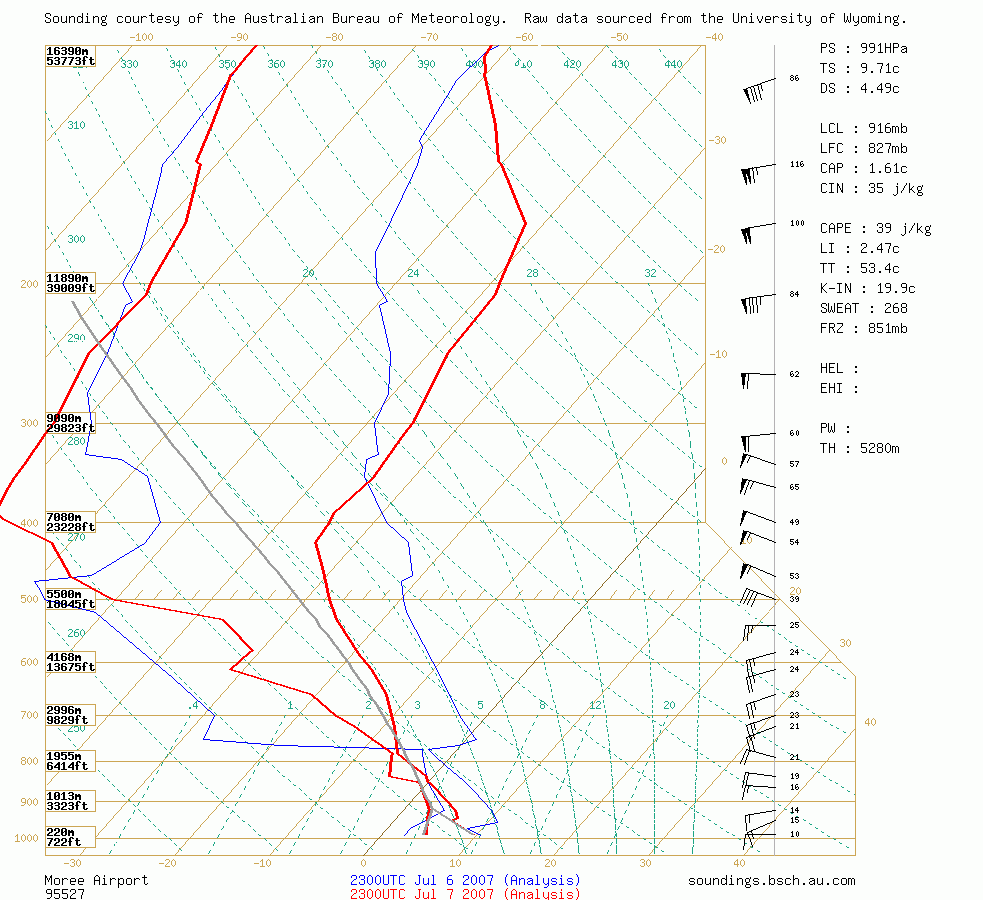
Satellite loops revealed the cold pool and upper low drew in significant moisture from the east late on the 6th and during 7th June. This moisture spiralled into Mt Kaputar during the afternoon of the 8th, and the Tenterfield and Granite Belt region from about 8pm onwards. During the 8th, Moree radar showed showers heading towards the higher ground.
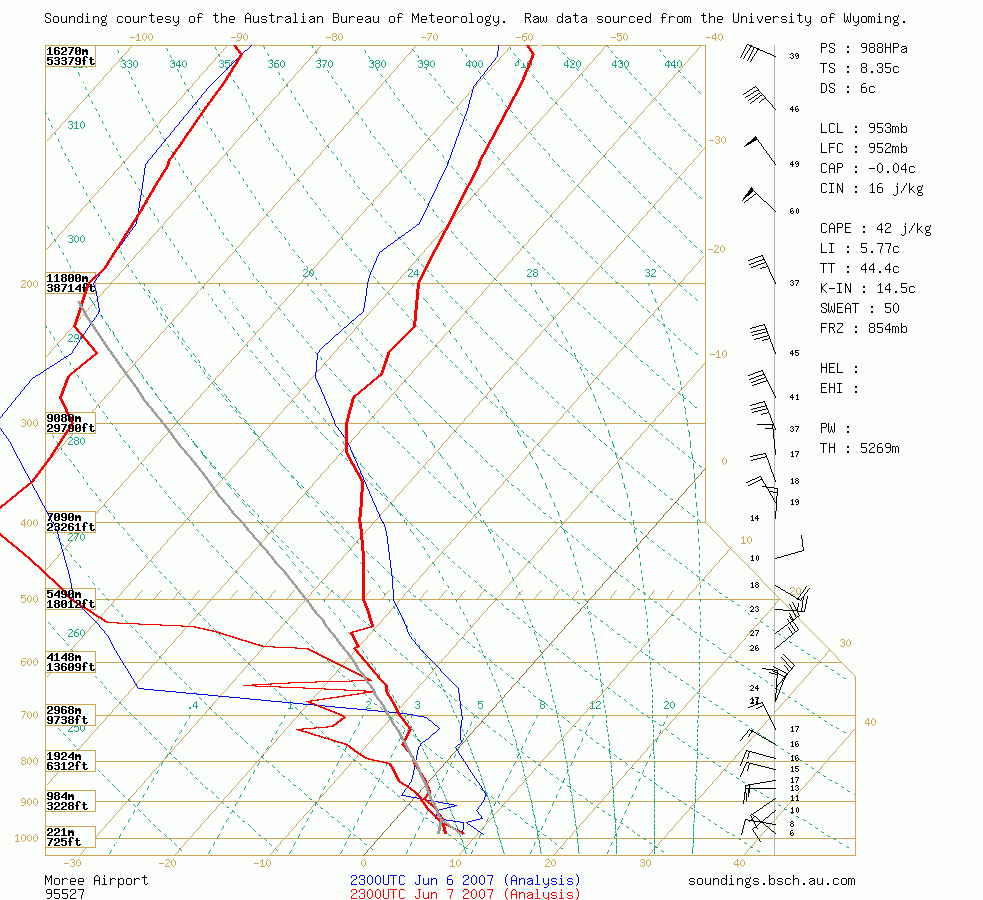 Moree Sounding 9am 8th June: The temperature and moisture profile was very good for convective type cloud formation, with good lapse rates up to 550hPa and freezing levels down to about 1300 metres. It did not matter that higher levels of the atmosphere were not impressively cold given the low to mid levels were ideal for snow.
As the intense low continued its havoc around Newcastle and the Central Coast, moisture was driven inland and wrapped into the more southern parts of the Northern Tablelands after midnight.
The unusual result was heavy snowfalls a few kilometres south of the Queensland border (29 degrees south) - and on lower terrain - several hours before snowfalls set in on the higher ground around Guyra.
Mount Mackenzie, elevation 1285 metres, had its heaviest snowfall since July 1984 with an accumulation of at least 8cm by dawn on the 9th. Snow fell to about 800 metres elevation in the area including at Tenterfield, but it did not accumulate for long in those lower areas due to warming temperatures and subsequent rain. Temperatures were not observed below freezing during this event.
The Guyra to Ben Lomond areas received a widespread cover of around 4cm of snow by Saturday morning. Mt Kaputar received a great 7-8cm snow depth.
Australian Severe Weather Forum discussion of this event.
 Weather Pictures
20th June 2007: [by Rodney Wallbridge]
Links to: [Weather maps & satpics]
The development of an East Coast Low was preceded by a cold pool heading northeast across Victoria and into NSW. The cold pool again targeted the Northern Ranges and forecasts were quite good for another decent snowfall.
A problem with this event was that the coastal low formed a little too far south and east and the anticipated good moisture levels over the tablelands did not eventuate. This can be seen in the infrared satellite loops which show extensive cloud over the Central Tablelands dissipating as it headed further north late on the 19th June. Additionally, the coldest upper level air did not make it to the Northern Tablelands.
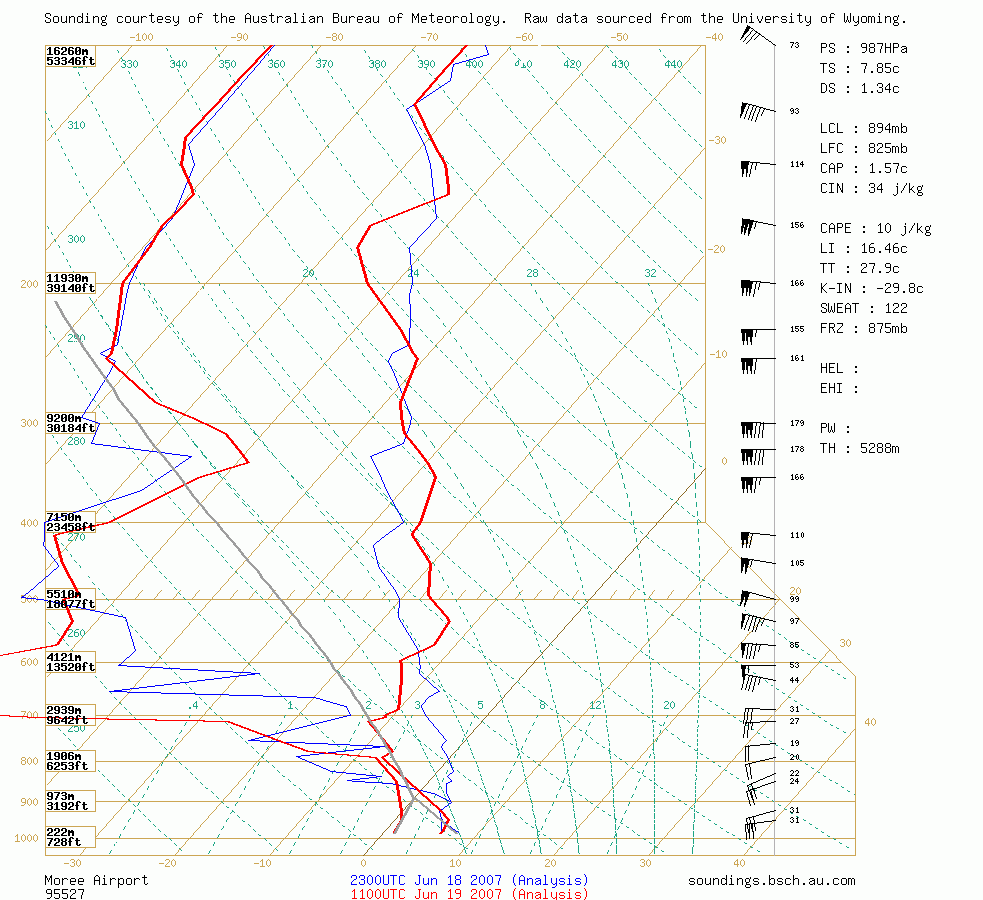 Moree Sounding 9pm 19th June: Temperatures between the surface and 700hPa (about 3000m) were very cold -with the freezing level about 1250 metres, however the temperature profile above this was too warm (relatively) and prevented extensive cloud formation.
Snow was observed falling as far north as Deepwater during the evening of the 19th. A 1cm cover of snow was observed by morning in the Guyra area.
Australian Severe Weather Forum discussion of this event.
 Weather Pictures
28th June 2007: [by Michael Bath]
Links to: [Weather maps & satpics] [GFS output] [TWC output]
A complex situation with two lows in the Tasman Sea 36 hours before the snow event. A cold pool moved across Victoria. The two lows merged into an intense East Coast Low near the border of NSW and Victoria and redirected the cold pool north-northeast towards the Northern Ranges.
The satellite loop had a dramatic pattern with the East Coast low and upper low interacting. It shows the moisture plume in the upper low targeting 30 degrees south quite nicely (Kaputar is 150.10E, Guyra 151.40E).
The timing of the coldest air and best moisture would see the early morning and early afternoon the best chance of snow in the Guyra area. 850hPa temps were a little too warm to expect a big accumulation of snow on the Northern Tablelands. Conditions were more favourable for snow on Mt Kaputar in the Northwest Slopes region, with plenty of moisture and colder 850hPa temps.
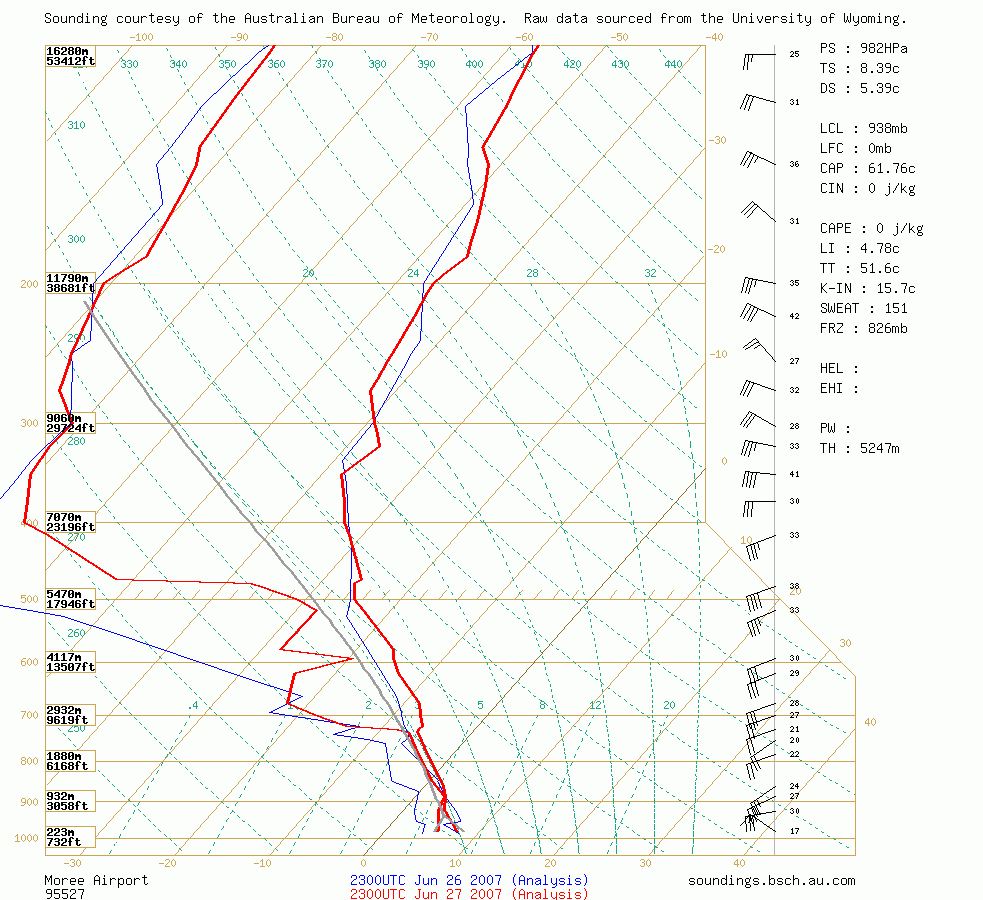 Moree Sounding 9am 28th June: Quite a nice profile for cloud formation and precipitation with a reasonable lapse rate, but temperatures a touch too warm. The freezing level is only about 1500 metres at this stage - but note this sounding was taken around the end of this event.
The moisture levels were better than anticipated with constant precipitation (drizzle) from east of Tenterfield, and along the New England Highway to Glen Innes and further south. Some snow fell but did not settle at Mount Mackenzie near Tenterfield late morning. Sleet was observed at Glen Innes and it was reported there was a light cover earlier in the day.
Snow had accumulated up to 3cm along Inn Road, Ben Lomond (elevation over 1400 metres), and it snowed for the 90 minutes following 12.30pm. The temperature remained 1 to 1.5 C during this snowfall. Possibly 4cm of snow fell in Ben Lomond village around dawn. Mt Kaputar received at least 10cm of snow from this event during the AM hours of the 28th, putting this system into the major category.
Australian Severe Weather Forum discussion of this event.
 Weather Pictures
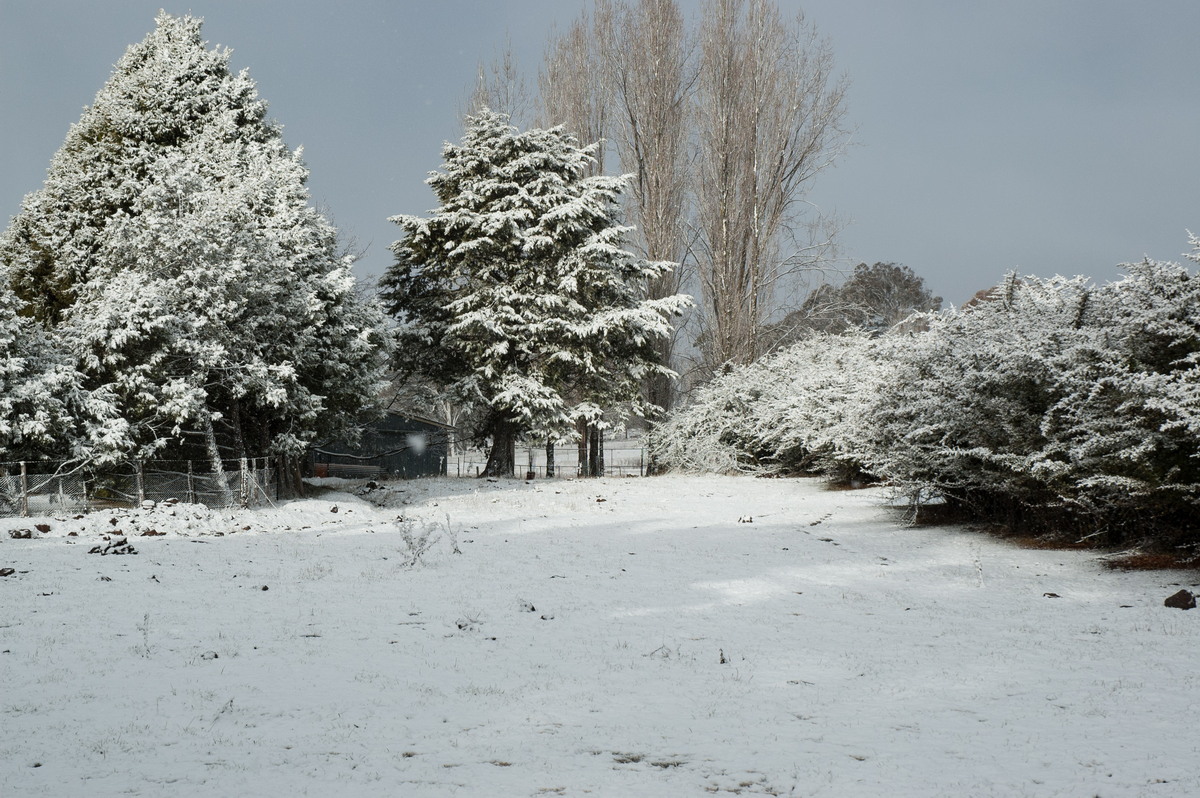
8th July 2007: [by Michael Bath] [by Chrissy Dott] [by Rodney Wallbridge]
Links to: [Weather maps & satpics] [GFS output] [TWC output]
This system turned out to be the third major event for the Northern Ranges in a month. The setup involved another cold pool with plenty of unstable air. A low had already formed southwest of Victoria and its slow movement across Bass Straight and into the southern Tasman Sea forced the coldest air west of the low to head north-northeast to the Northern Ranges. Earlier forecast runs were tipping the coldest air to pass over the Central Ranges but it soon improved for northern areas.
The timing of the cold unstable air meant that early to late afternoon would be the peak opportunity for snowfalls. The system was different to previous ones in that it allowed the formation of large convective clouds including low topped thunderstorms to form.
The satellite loop with this event is quite revealing, clearly showing the very cold air passing over Victoria and inland NSW, then interacting with a moisture plume from the low when it was positioned in eastern Bass Straight. Widespread large cumulus and cumulonimbus clouds can be seen passing over the Northern Tablelands during the afternoon of the 8th July. Radar was also picking up these showers and low topped thunderstorms.
 Moree Sounding 9am 8th July: Very good profile for both temperature and moisture with very cold air right up to about 6,500 metres. 850 hPa temps were not overly impressive but with the good lapse rates, snow showers were very likely on ground above 1,200 metres.
Some brief snow was reported at Guyra during the morning. Wintry cumulonimbus and large cumulus was observed from late morning, with the first snow shower seen at Glen Innes. Snow showers then occurred throughout the afternoon and into the early evening on the higher parts of the Northern Tablelands. Extensive lines of convective snow shower activity from 2.45pm near Llangothlin (this included some thunder), from about 4.30pm at Ben Lomond, and at Guyra soon after that were the major 'snow events' within the overall event. It was amazing to witness sunny patches and cumulonimbus clouds mid afternoon, while at the same time seeing the whole area white from snow. Temperatures were typically around 1C during the snowfalls and rising to 2C or more during the breaks in shower activity. The lowest temperature observed was 0.3C later that night near Ben Lomond.
The cover on all terrain above 1,250 metres elevation was very impressive and soon led to road closures south of Glencoe, and at Black Mountain. A large truck jack-knifed on the Ben Lomond Range and resulted in the New England Highway being closed from 5pm onwards.
4 to 6cm of dry powder snow covered many areas including Guyra and this was still on the ground well into the following day.
Given the background information and case studies presented above, and you want to see snowfalls on the Northern Ranges, a few steps need to be taken.
Keep in mind:
Now to the resources available to forecast and plan a snow chase:
If you have the required level of access, check all these following variables
for GFS, TWC and MLAPS models and compare the output.
| Example | Chart heading | What it shows | What you need |
 |
MSL Pressure / Thickness / Rainfall (MSLP, THK, PRECIP) |
- Surface pressure - 500hPa thickness - Accumulated precipitation amount |
- Some precipitation
to be present. - Lower 500 hPa thicknesses (colder atmosphere). - The blue line is the 5,400 metre thickness, which indicates where snow would fall if the terrain is about 1,500 metres or higher, and other conditions are present. |
 |
500hPa
Temperature / Wind / Height (TMP, WIND, HGT 500 hPa) |
- Temperature
at 500 - Wind speed and direction at 500 - HGT shows the height in metres of the 500 hPa level. |
- Values below
-20 for temperature. - The blue line represents -20. |
 |
850hPa Temperature / Wind / Height (TMP, WIND, HGT 850 hPa) |
- Temperature
at 850 - Wind speed and direction at 850. - HGT shows the height in metres of the 850 hPa level |
- Values at or
below zero. - A lower 850 hPa thickness is better as the freezing level will be closer to the ground and more likely to impact with the terrain. |
 |
700hPa Relative Humidity / Wind (RH, WIND 700 hPa) |
- Relative Humidity
at 700 - Wind speed and direction at 700 (about 3,000 metres) |
- Prolonged periods
with the RH at or above 70 percent. - This level in the atmosphere gives you a good indication of how much thick cloud there will be. - Values below 50% (no shading) suggest the only snow will be from orographic forcing of low level clouds. |
Check additional variables output from the GFS model on Weatherzone. Snow forecast maps for the Central and Northern ranges are only available for Weatherzone silver subscribers.
| Example | Chart heading | What it shows | What you need |
 |
Snow Level | - The snow level
in metres - Accumulated precipitation amount. |
- 1,400 metres
or less over the target area. - Some precipitation to be present. |
 |
Snow forecast | - Accumulated
snow amount (cm) - Presence of precipitation - Snow level in metres |
- 1,400 metres
or less for the snow level - Precipitation (grey shading) - Snow accumulation north of Armidale. |
Free snow forecast maps based on the GFS model are also available from Snow Forecasts. These maps only extend north to about Glen Innes.
| Example | Chart heading | What it shows | What you need |
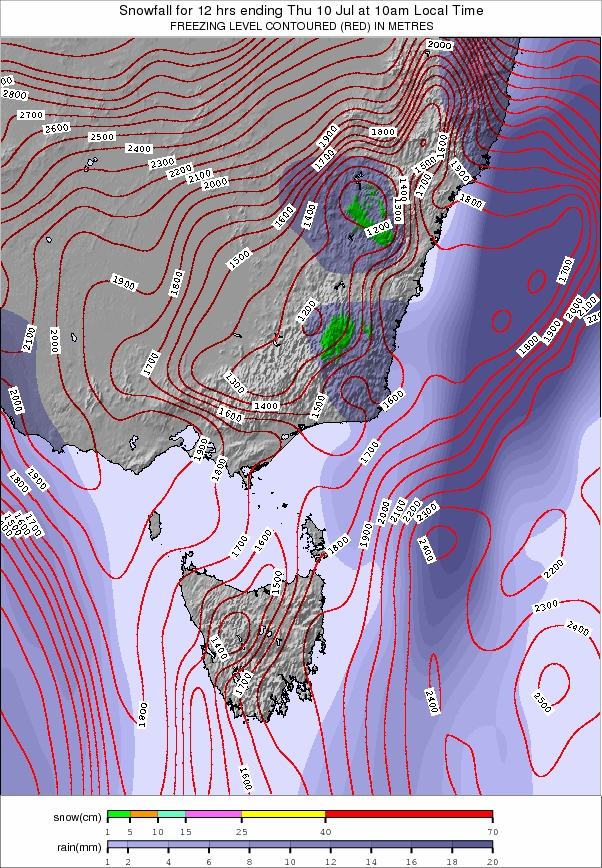 |
Snow Forecast Southeast Australia | - Accumulated
snow amount (cm) - Accumulated rain amount (mm) - Snow level in metres |
- 1,400 metres
or less for the snow level - Rain accumulation - Snow accumulation north of Armidale. |
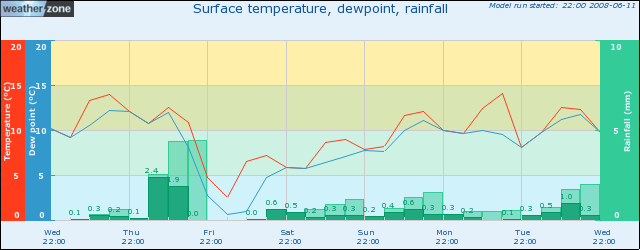
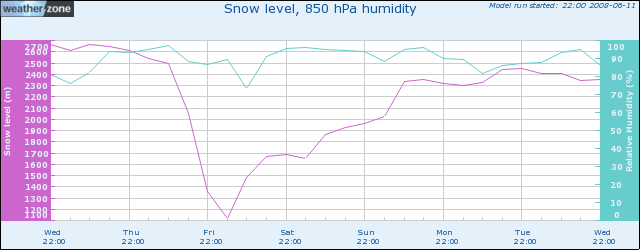
Weatherzone provides model output meteograms to its Silver subscribers. These provide graphical plots of the forecast conditions in a format where it is easy to compare variables across four different models. This service has recently been enhanced with the addition of plots for Guyra. Two examples are shown here:
Further information on Northern Tablelands weather and snow events over the years can be found on The Weather at Guyra NSW.
|
Document: snow_chase_guide.htm Updated: 4th July 2008 |
[Australian Severe Weather index] [Copyright Notice] [Email Contacts] [Search This Site] |