and Chasing
[Index][Archives]
Major Flooding of the Wilsons River in Lismore: Wednesday 29th and Thursday 30th June 2005
Report compiled by Michael Bath and Dave Ellem
| Storm News and Chasing [Index][Archives] |
Major Flooding of the Wilsons River in Lismore: Wednesday 29th and Thursday 30th June 2005 Report compiled by Michael Bath and Dave Ellem |
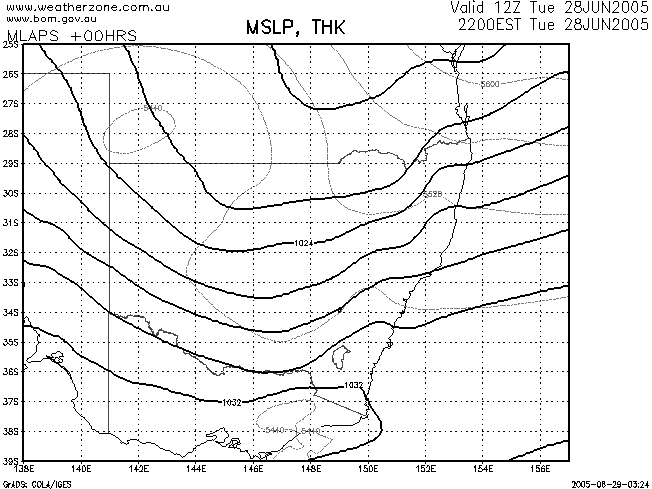
A slow moving upper low in Western NSW, coupled with a strong high feeding
moist NE winds into a deep trough on the East Coast of Australia provided the
perfect setup for an extreme rainfall event in SE QLD and NE NSW, with heavy
showers starting over the region on Monday the 27th of June. By Wednesday afternoon
very heavy rainfall was occurring across the Northern Rivers and SE QLD coast
and this continued right through the night into Thursday morning, when rain
began to ease from around 10am onwards. Over a 48 hour period, falls of up to
500mm had been recorded in the Wilsons River catchment, leading to the issuing
of a major flood warning for the Wilsons River at Lismore by early Thursday
morning.
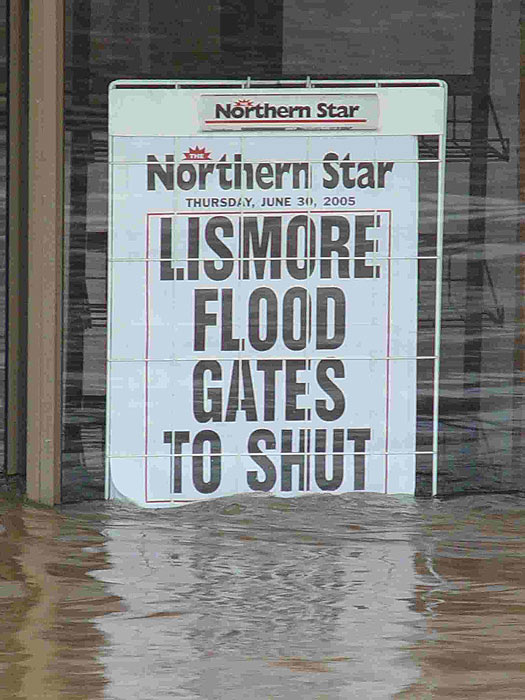
The Bureau of Meteorology forecast a peak of around 10.4m, which traditionally
would have flooded the Lismore Central Business District. However the completion
of a new flood levee in Lismore in March 2005, which protects the CBD from floods
up to around 10.8m, made this a unique major flooding experience. With no certainty
over whether the peak would be higher than forecast, the NSW State Emergency
Service called for the evacuation of the CBD as a precaution, along with the
evacuation of North and South Lismore, which aren't protected by the new levee
system. Fortunately, the heaviest falls during the rain event occurred in the
Eastern half of the Wilsons catchment area, while the Western half saw totals
of only around 100-200mm for a 48 hour period. This resulted in Leycester Creek,
which meets the Wilsons River at Lismore, to contribute little volume of water
in comparison to the Wilsons River. As a result, the floodwaters peaked at 10.2m
at around 10pm on Thursday night, leaving the CBD safe from major flooding.
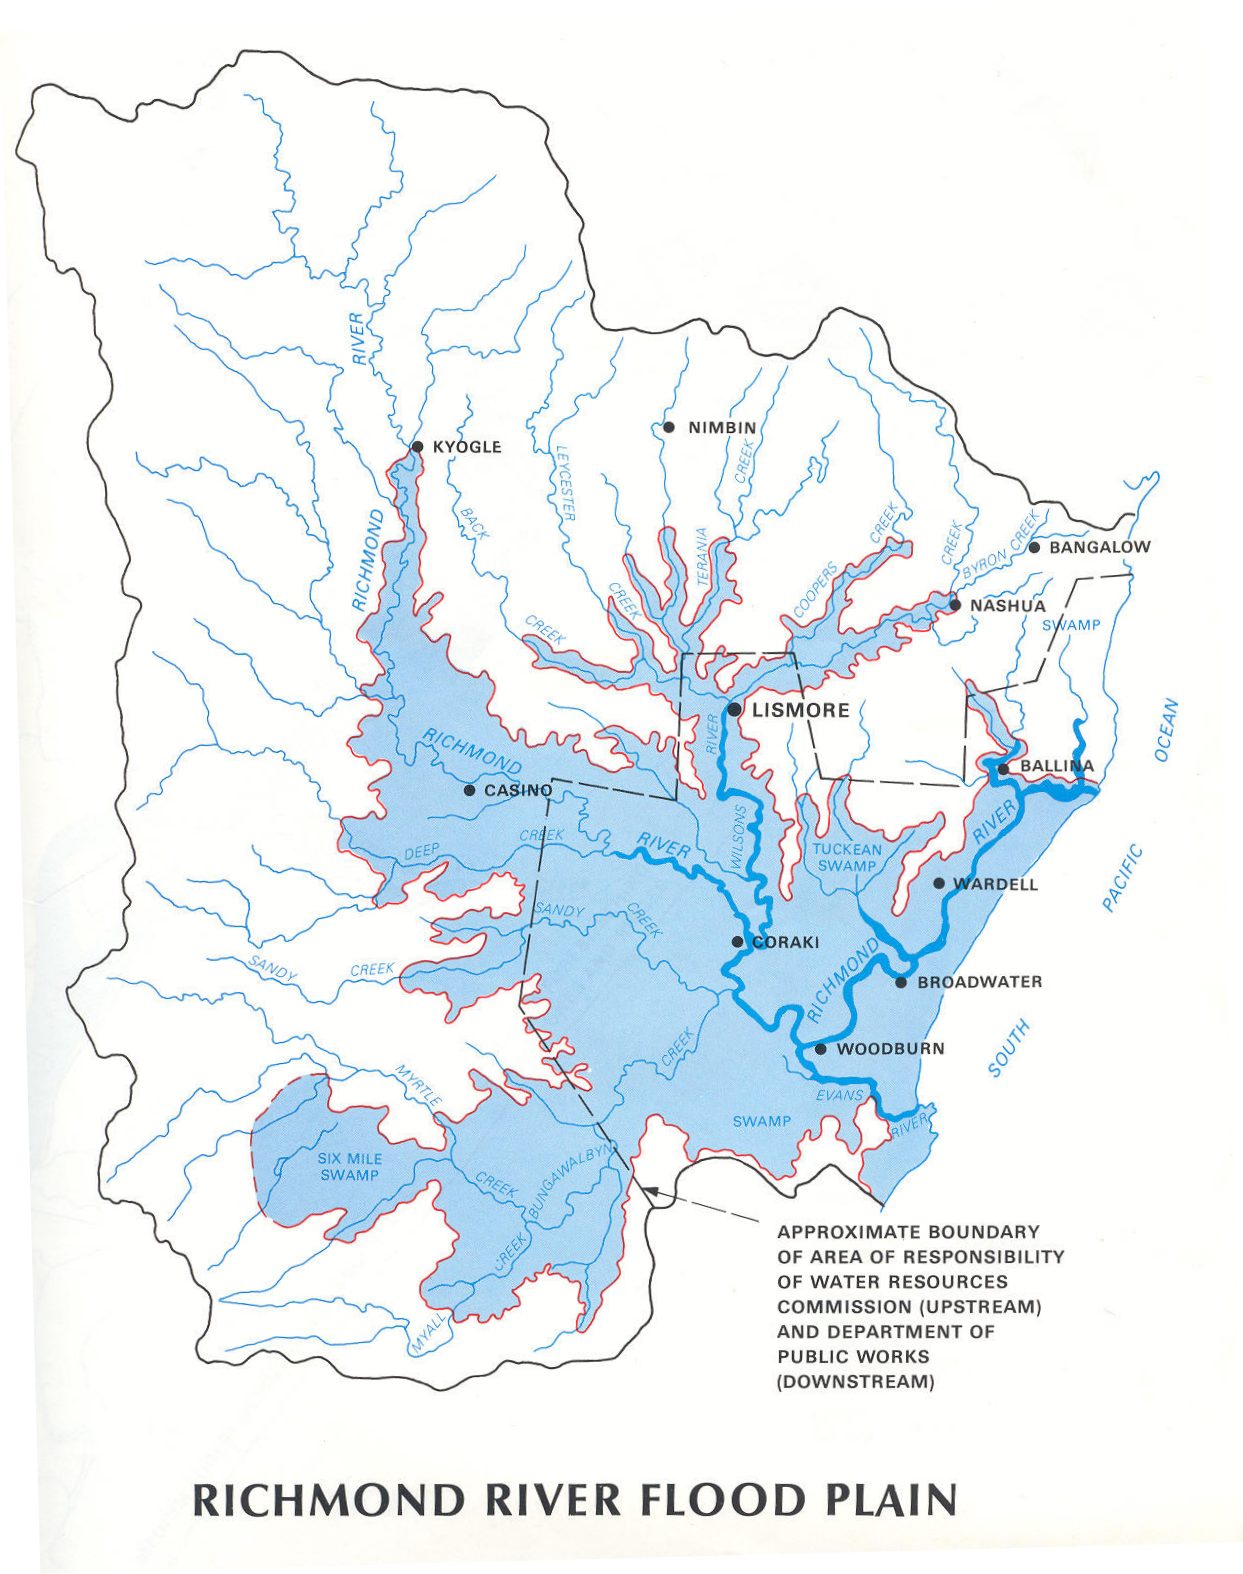
Click the map for a larger view of the floodplain
Moderate flooding was experienced downstream at Coraki and Bungawalbyn, while
minor flooding occurred at Woodburn on the morning of the 2nd of July. While
the rainfall event was extreme in the the totals that fell, their restriction
to the coast prevented would could have been a devastating major flood in which
the new levee system would have been overtopped.
Meanwhile, falls well over 500mm over a 48 hour period in the Brunswick River
catchment led to the worst flooding since the 1974 flood at Billinudgel and
Ocean Shores. In fact Mullumbimby recorded its wettest day in June since 1910,
with 287mm recorded to 9am on the 30th of June. Homes and business were flooded
in the area, towns isolated, along with blackouts lasting up to 2 days.
The story was even more extreme on the Gold Coast, where up to 500mm of rain
fell in just 24 hours causing massive flash flooding right across the Gold Coast,
resulting in some of the worst flooding in the area since 1974. Most of the
Gold Coast came to a standstill on Thursday morning as many roads went underwater
(including the Pacific Motorway and Gold Coast Highway), power was cut, businesses
and homes flooded, and even the Gold Coast Airport shut down due to the runway
going underwater. Sadly 2 people were killed when their vehicle was washed into
the Coomera River by raging waters flowing over a bridge. The damage bill from
the extreme event of the Gold Coast is expected to run into the millions.
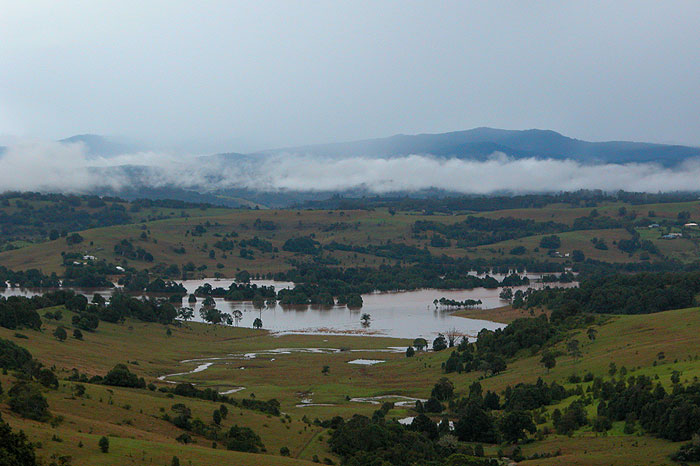
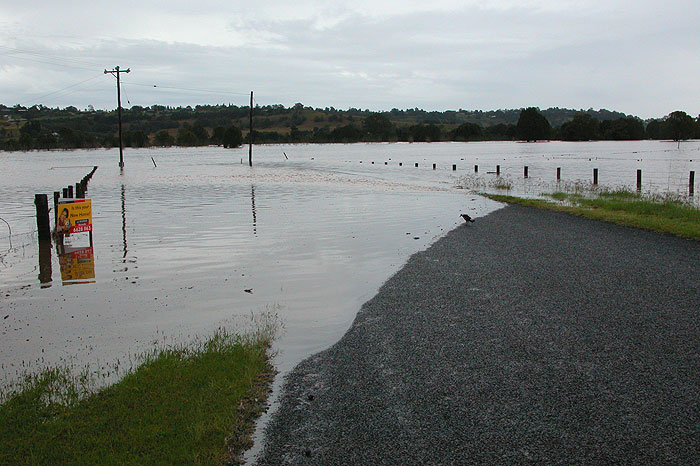
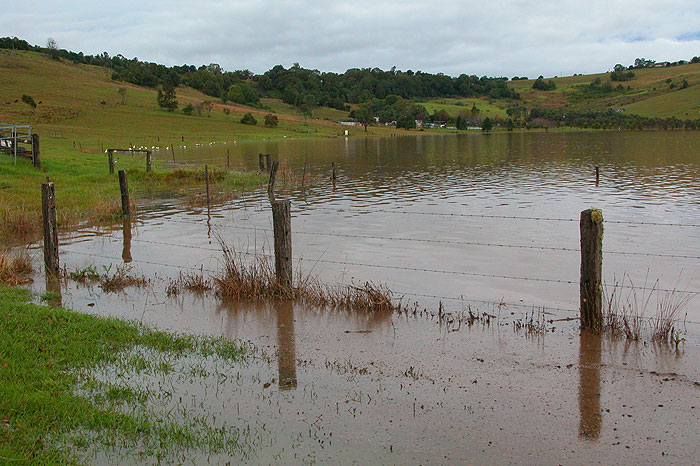
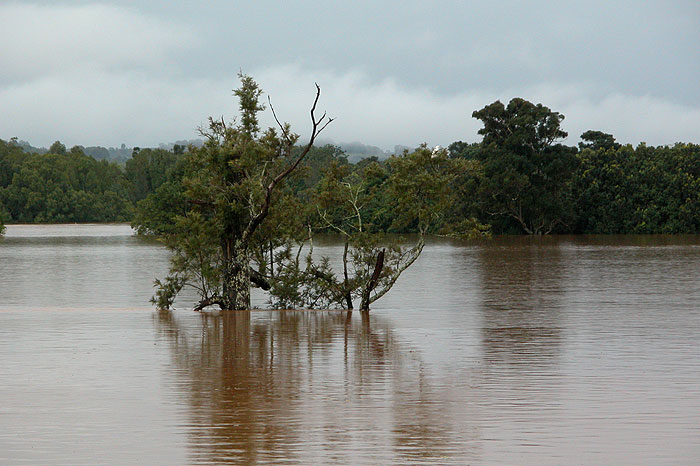
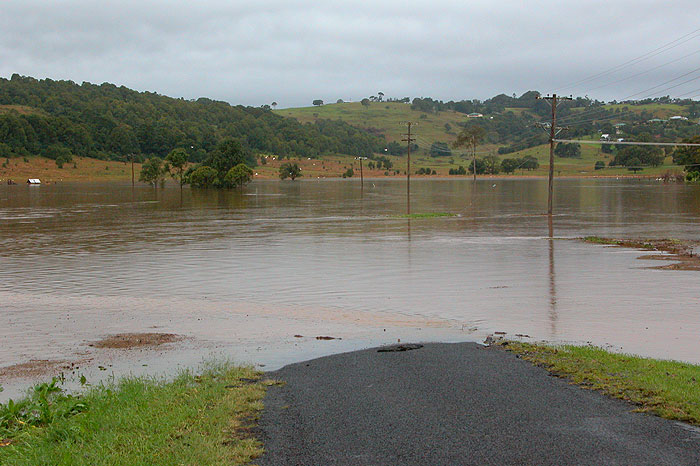
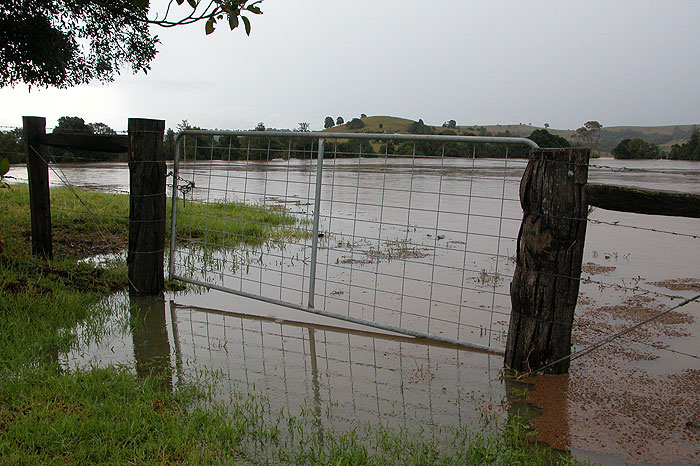
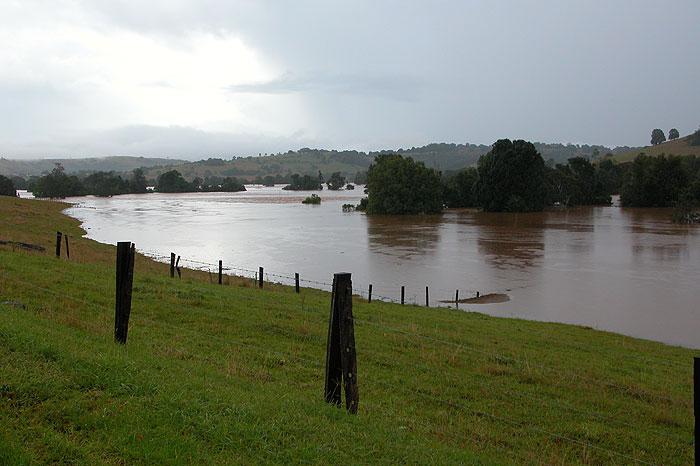
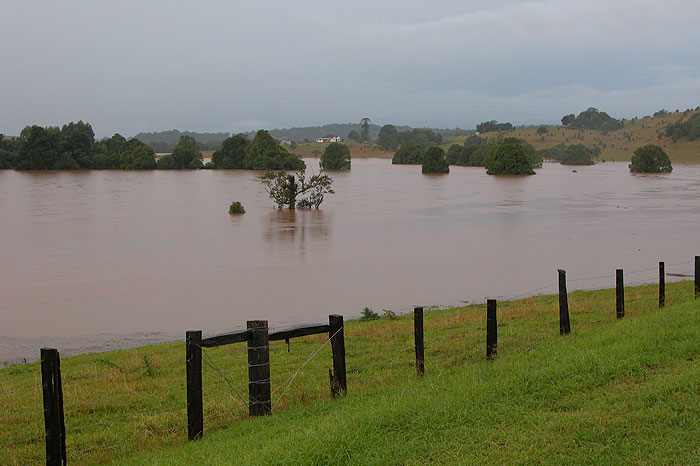
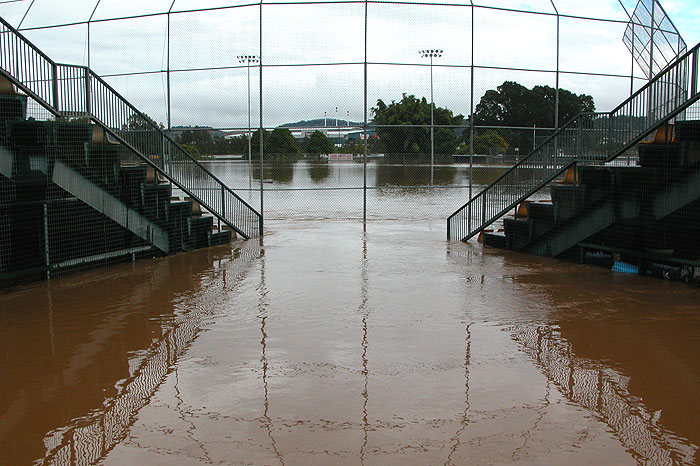
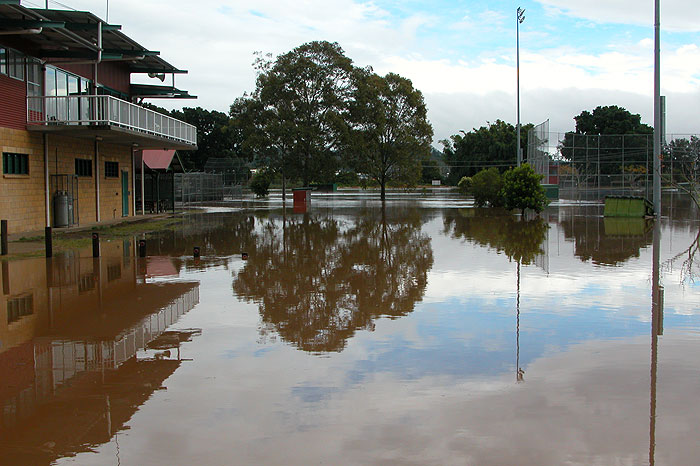
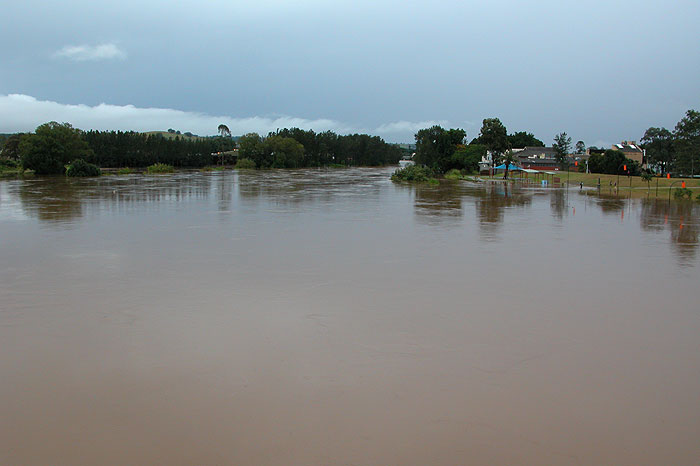
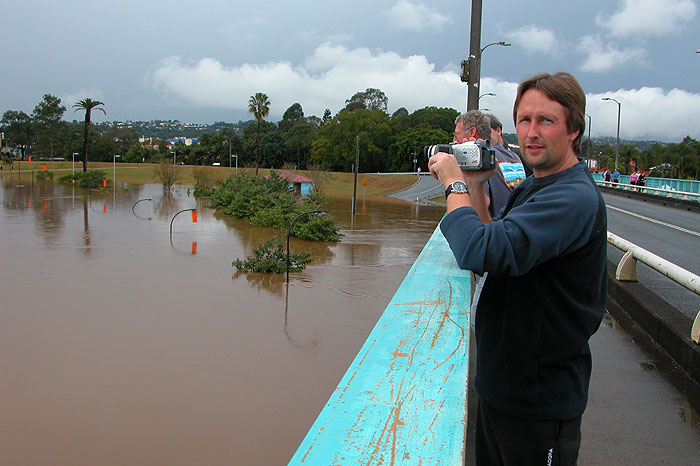
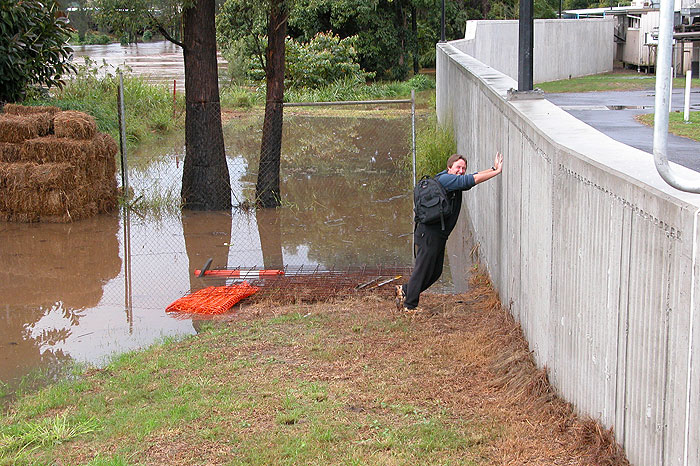
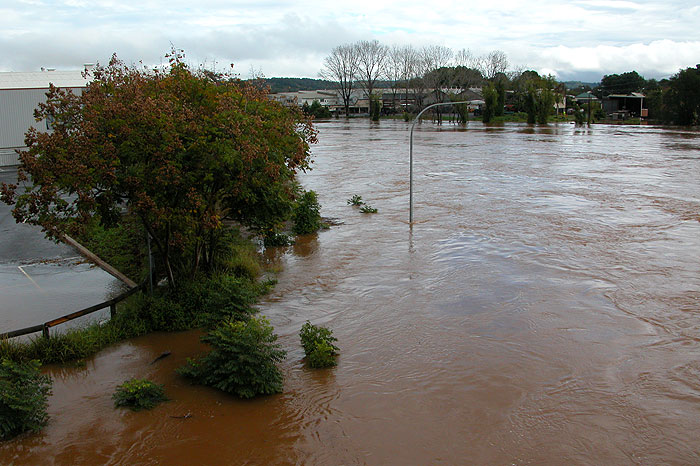
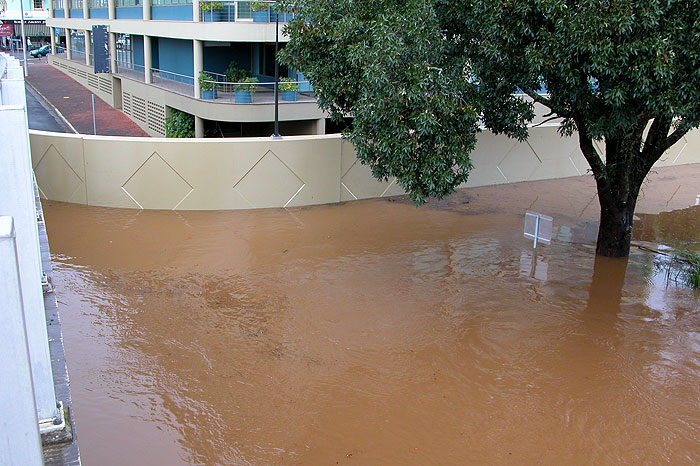
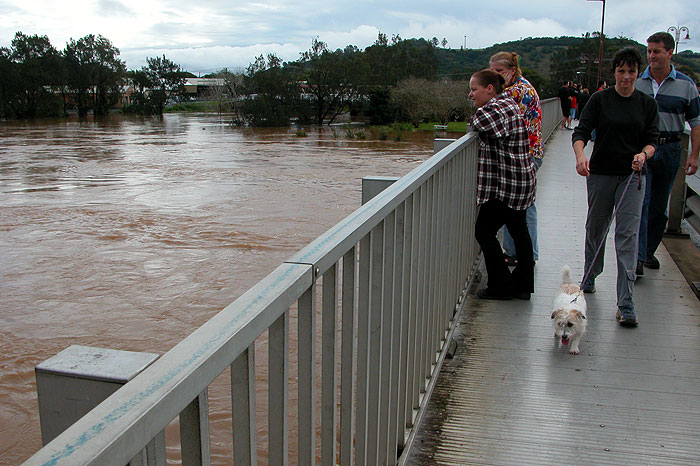
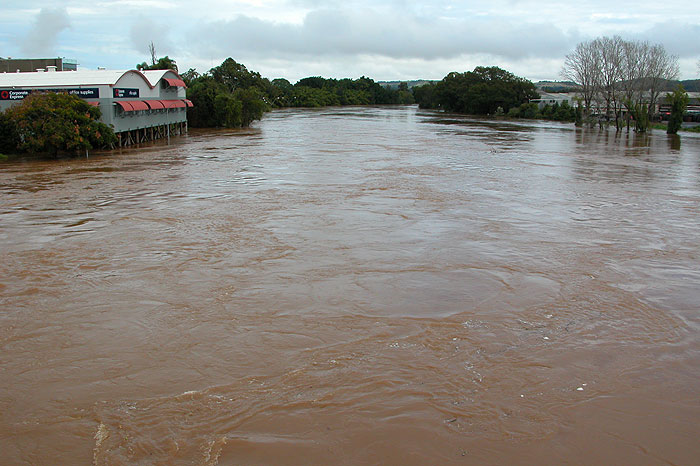
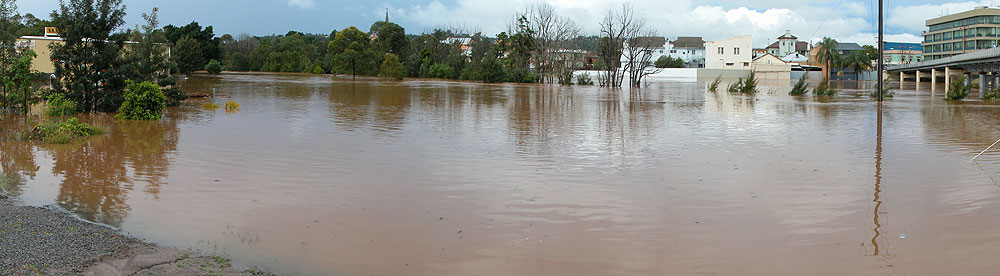
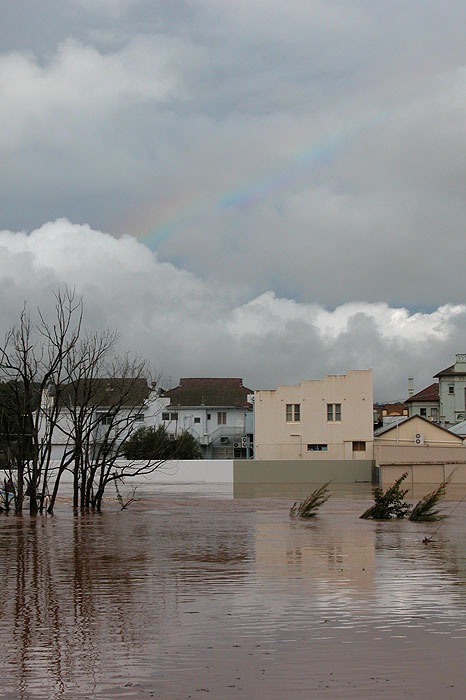
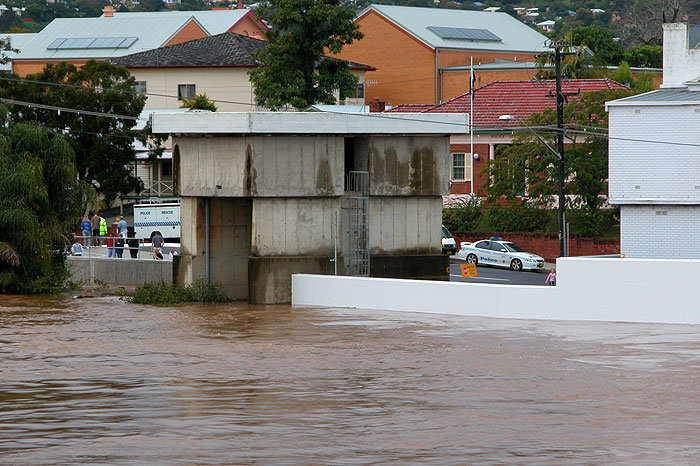
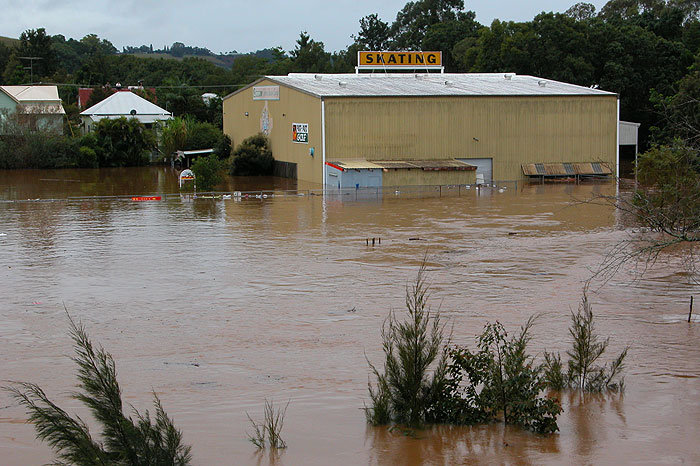
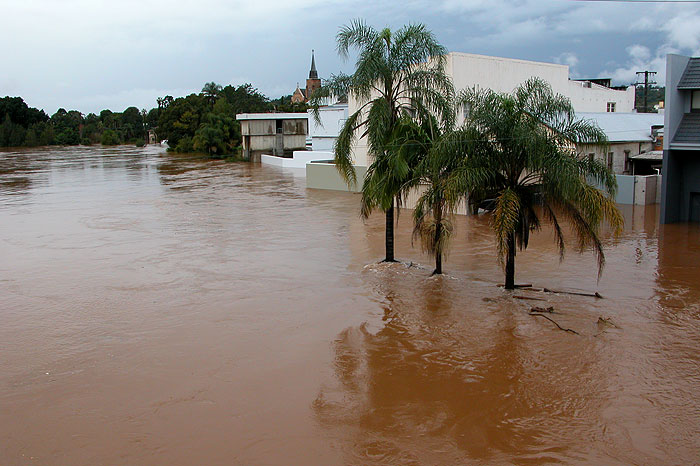
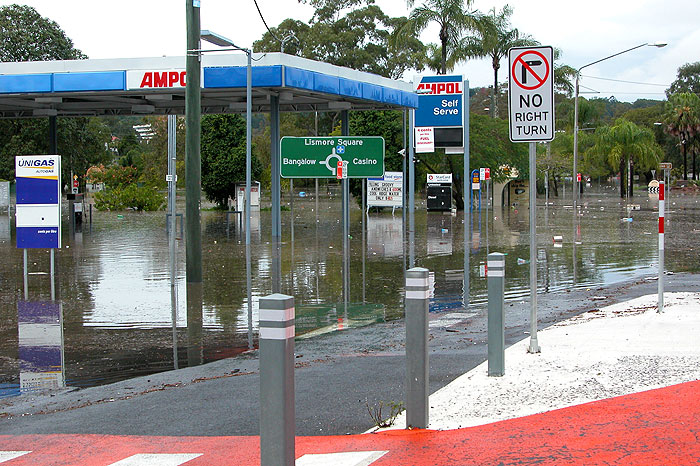
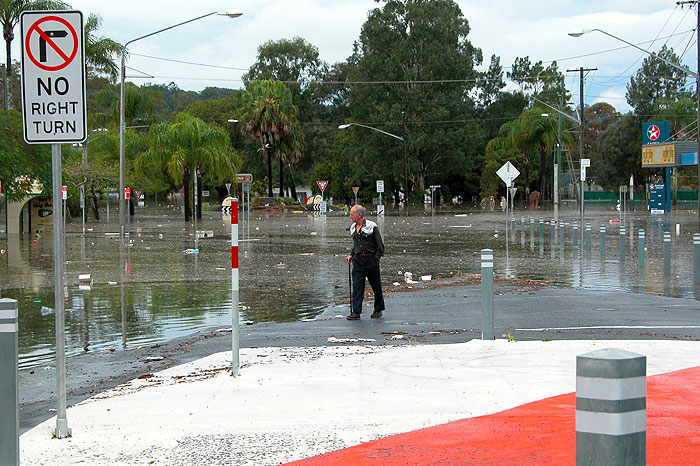
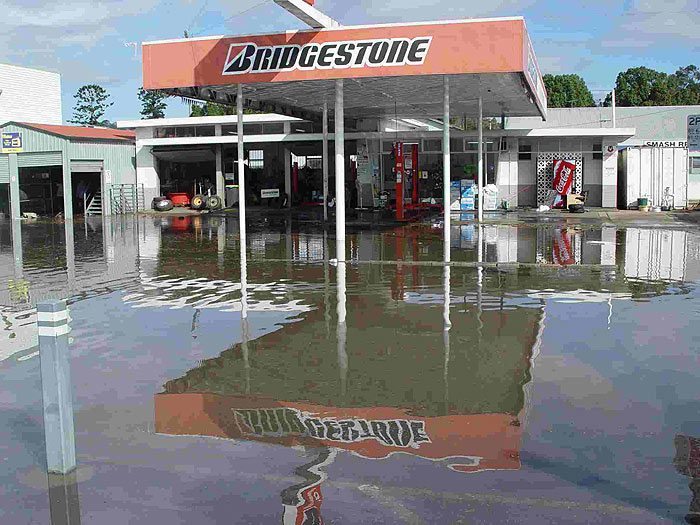
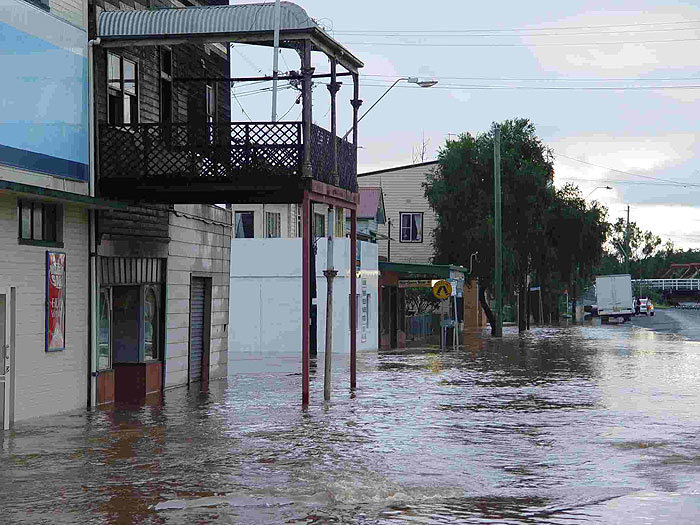
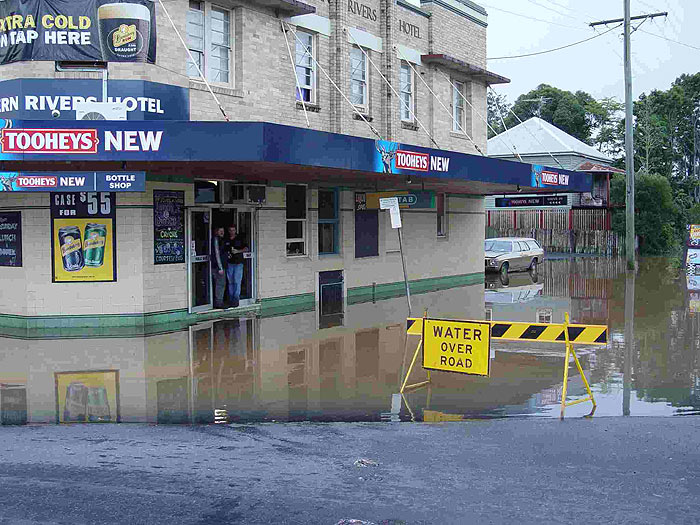
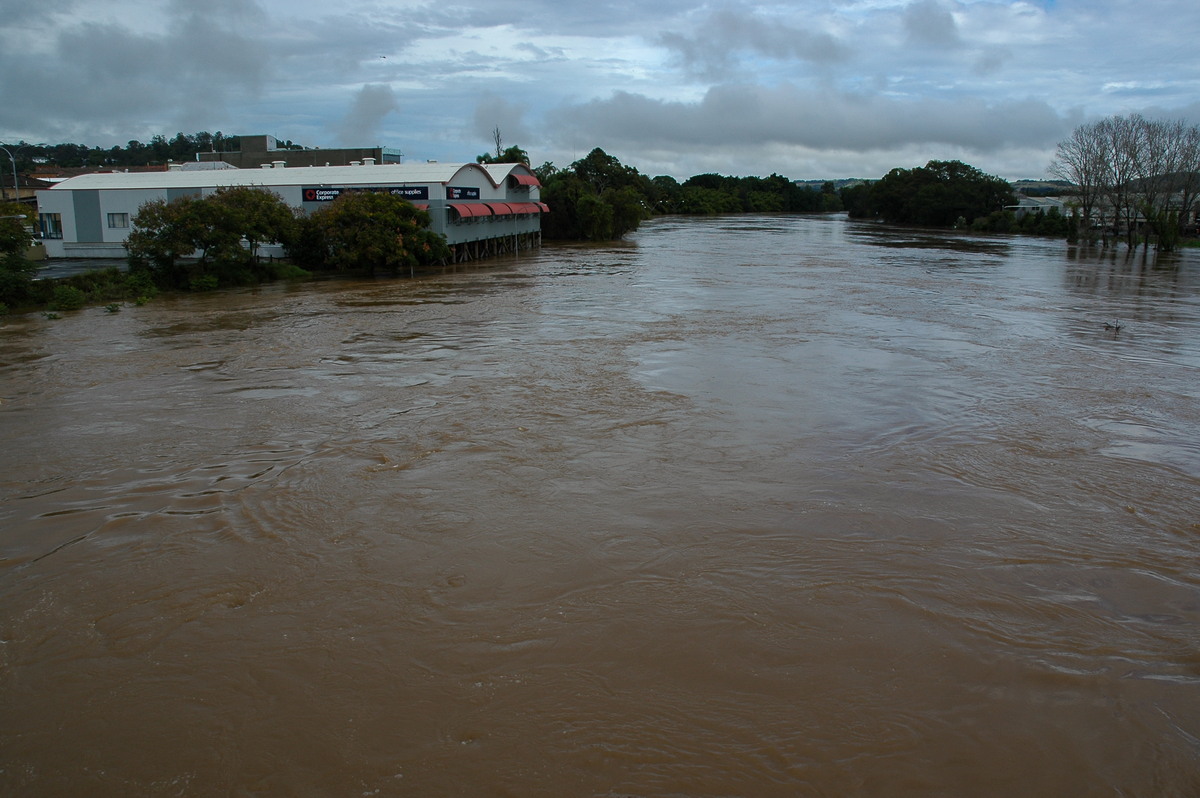
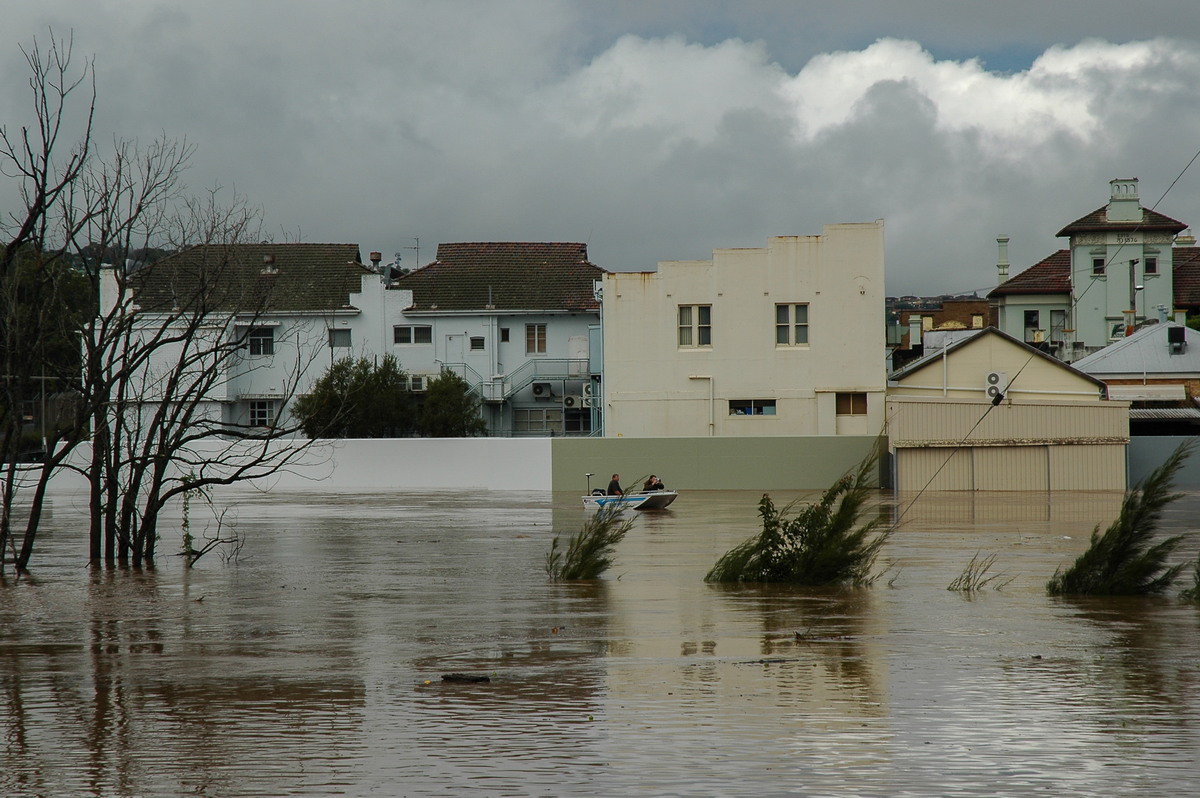
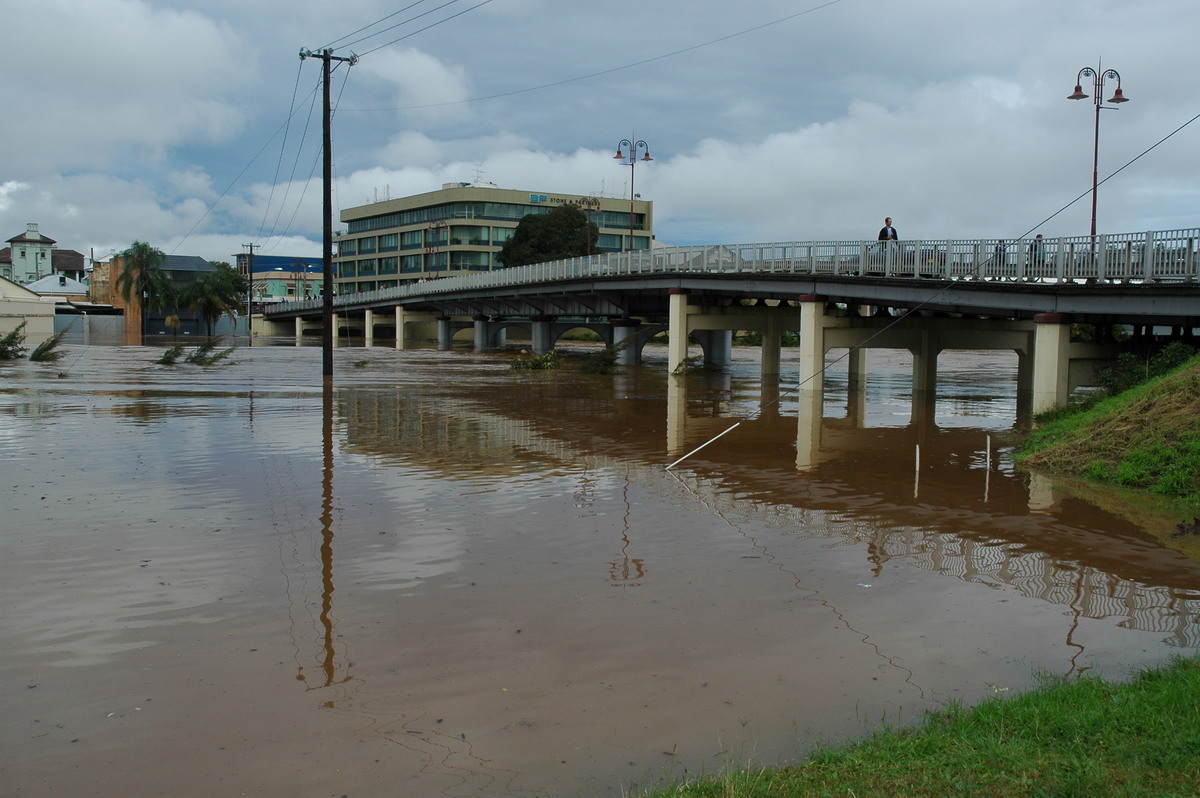
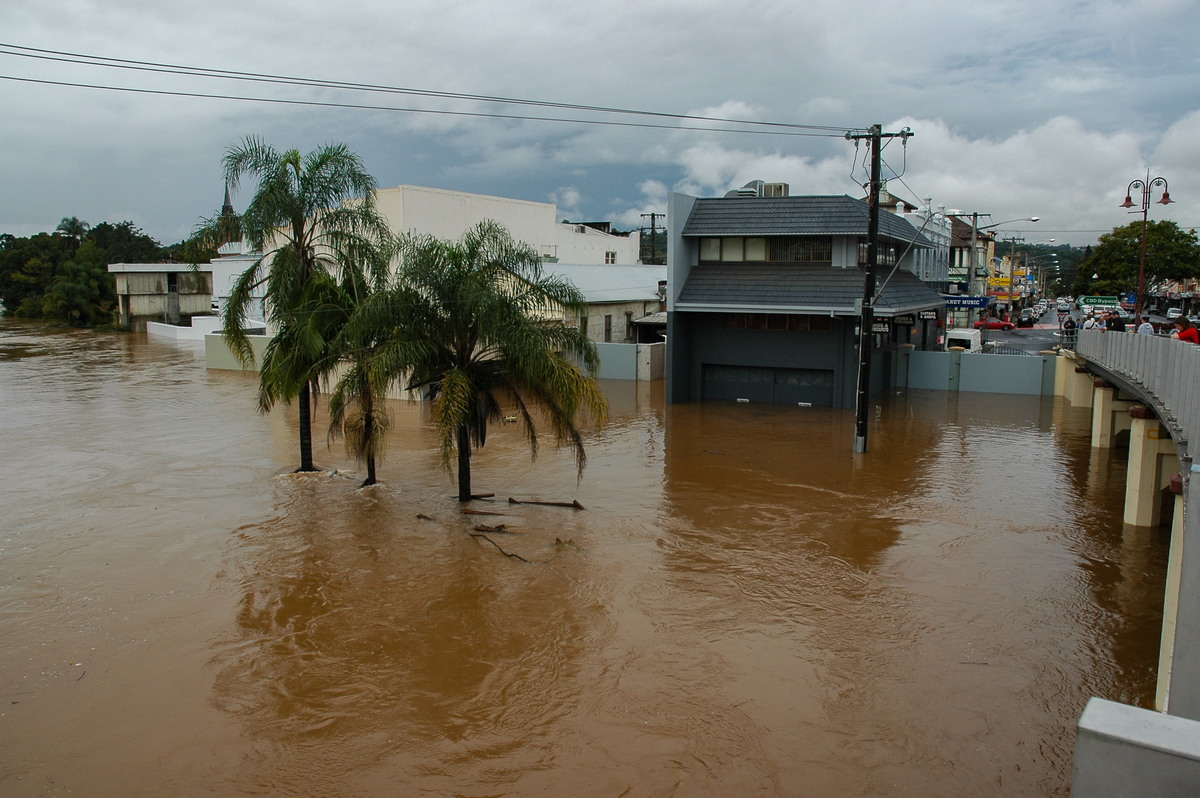
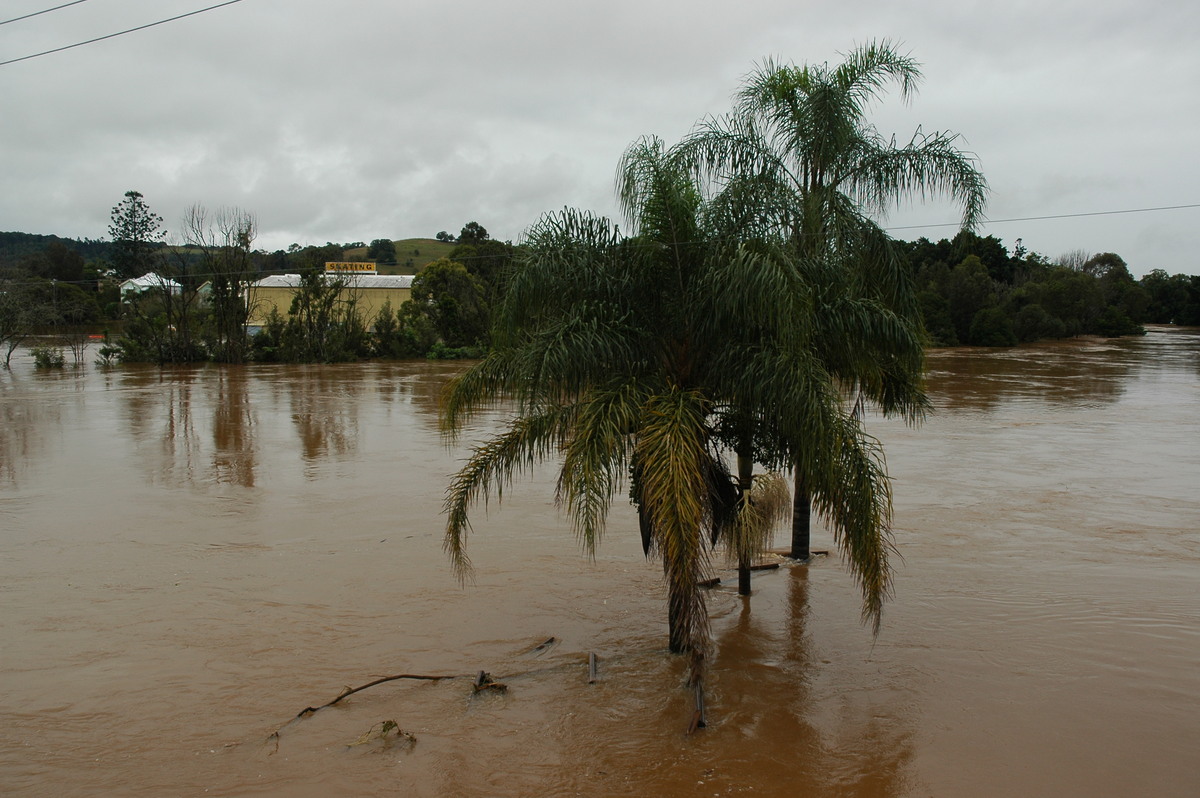
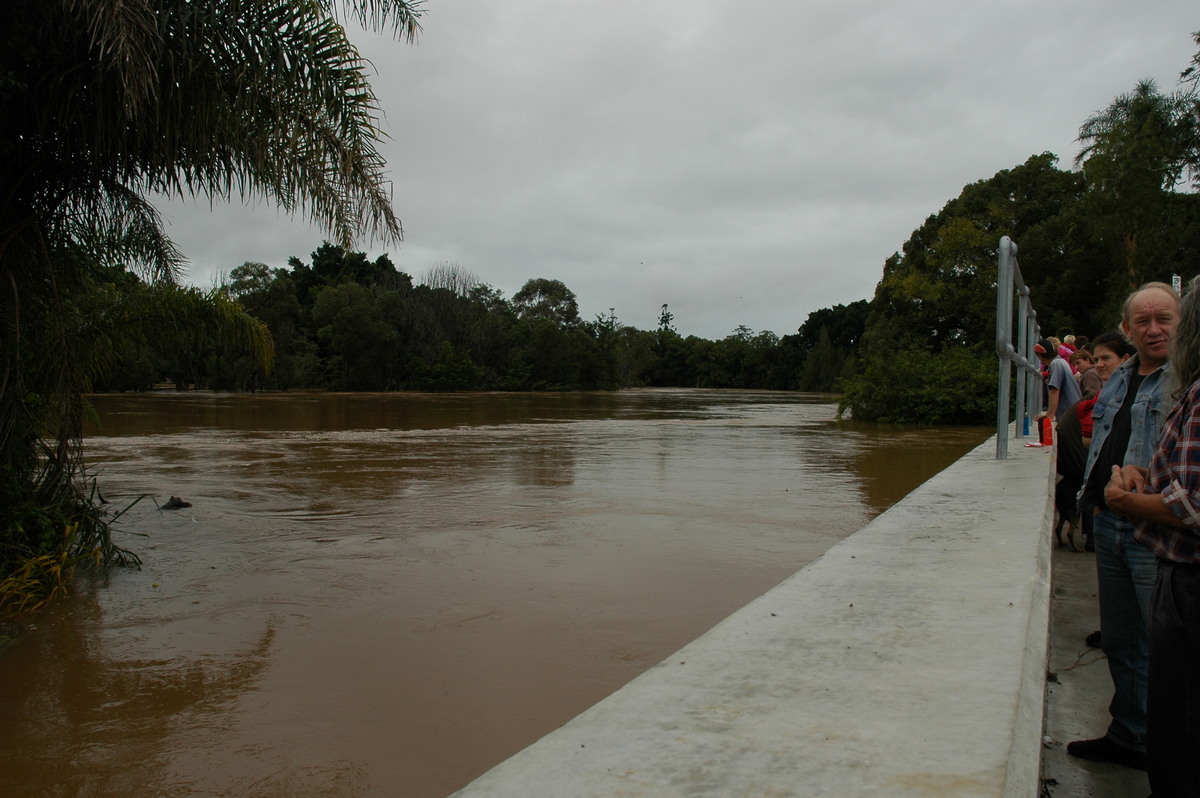
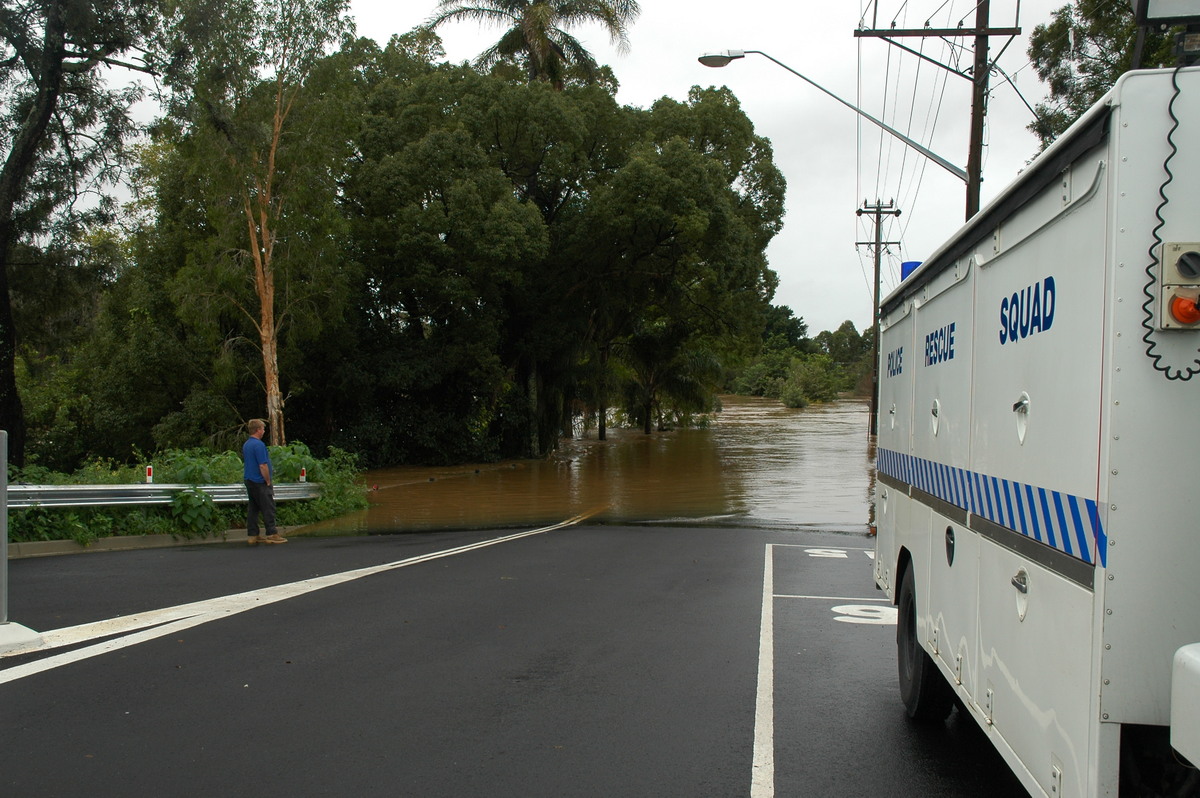
Below are a collection of photos taken from around the Lismore region on Thursday
afternoon, when major flooding occurred at Lismore. More photos and weather
data to be added soon.
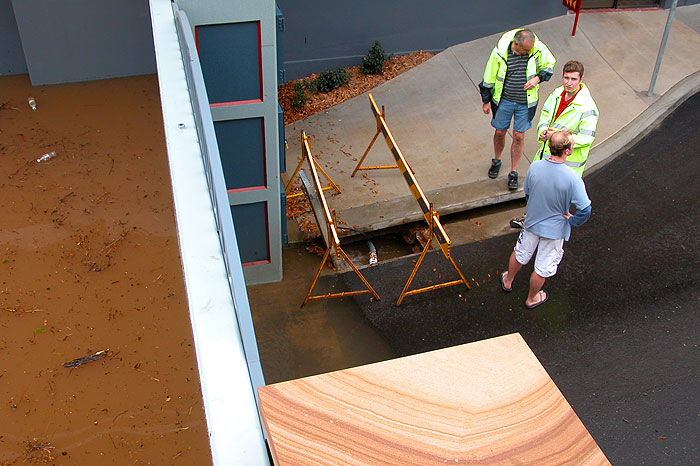
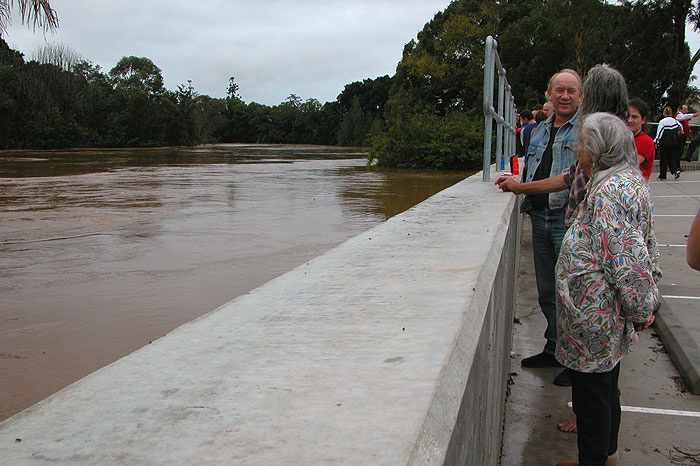
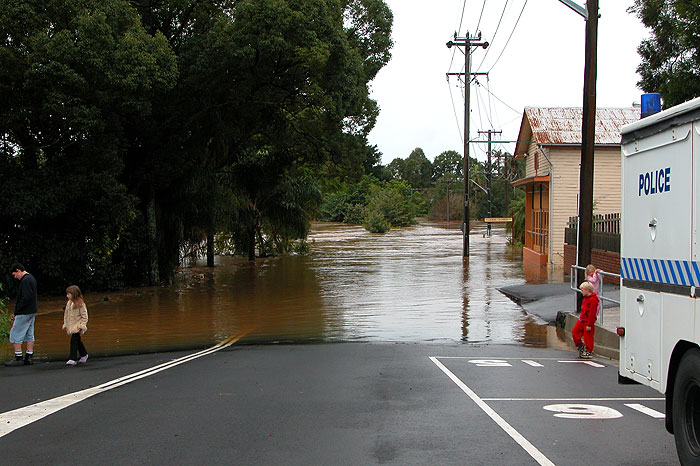
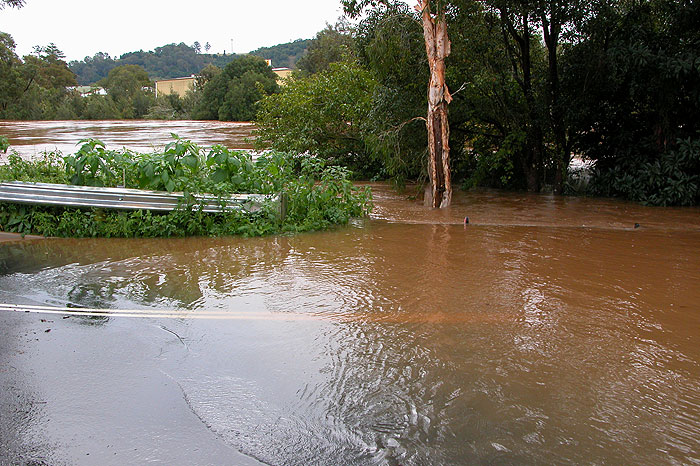
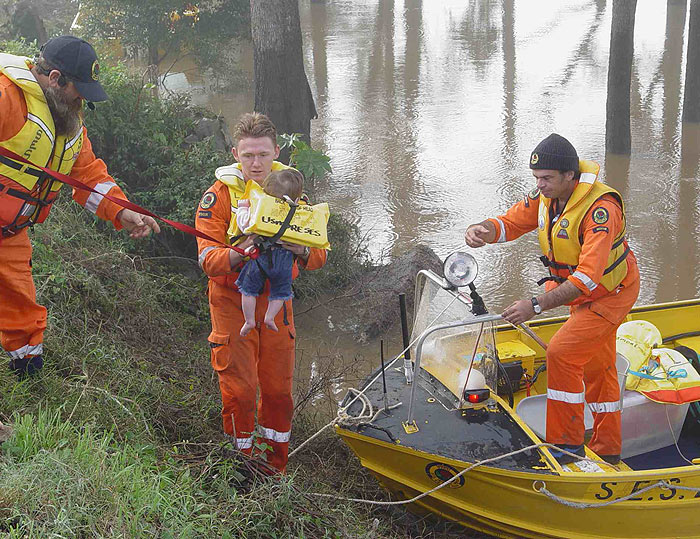
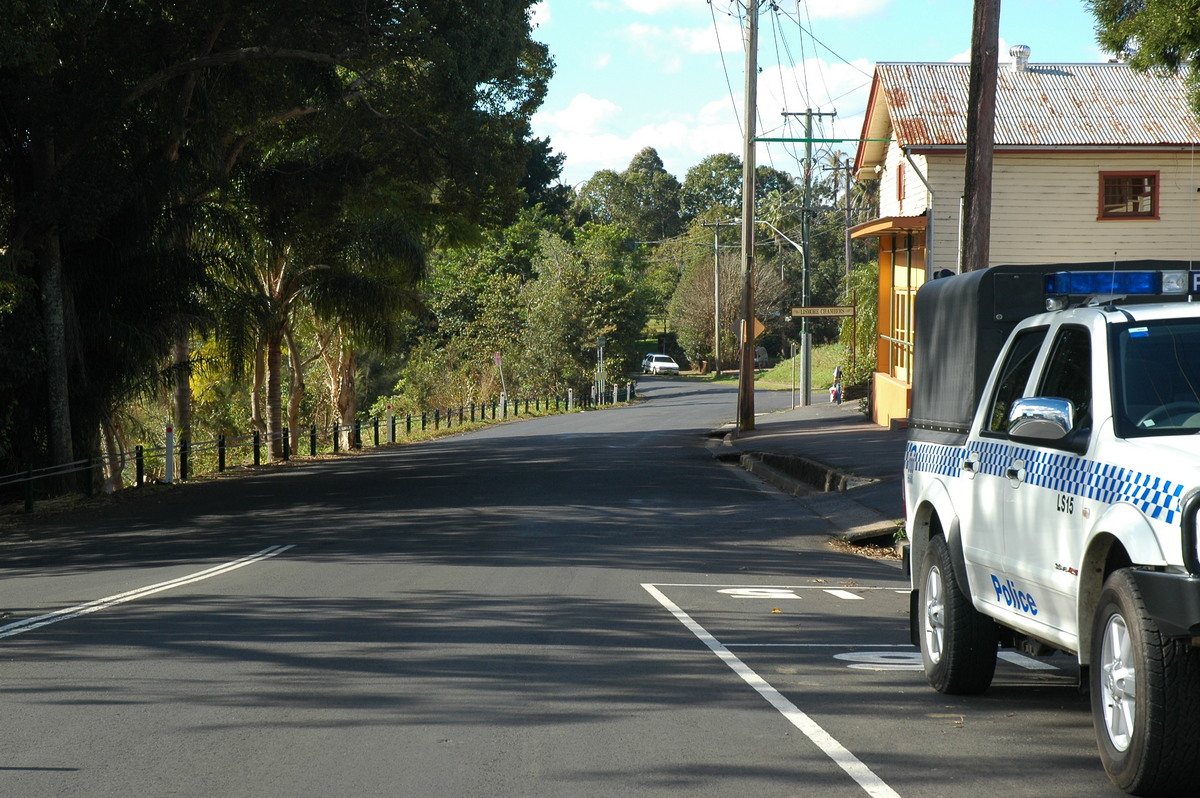
The following photos were taken around Lismore on Thursday. Thanks to the NSW SES for these photos.
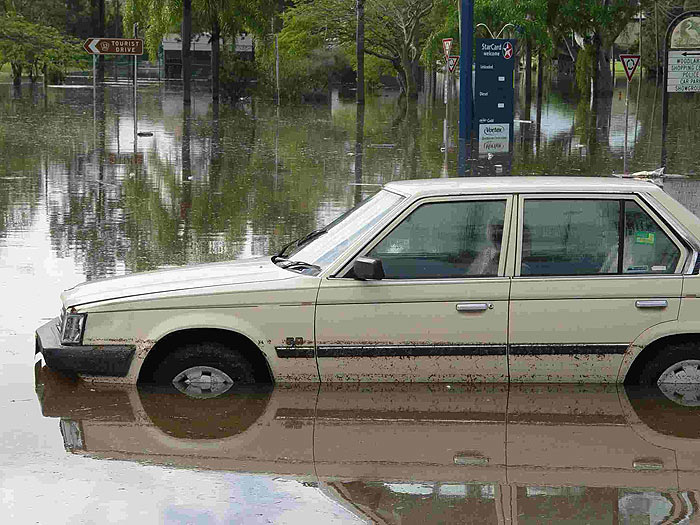


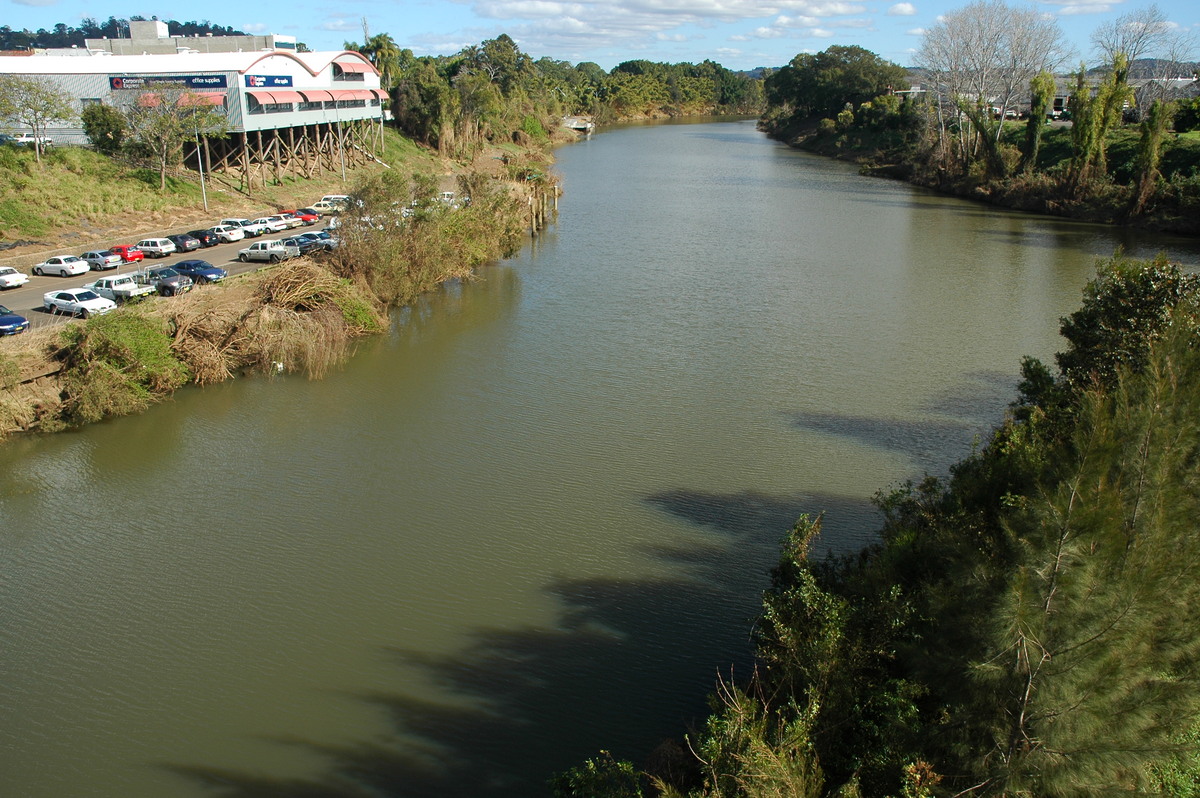
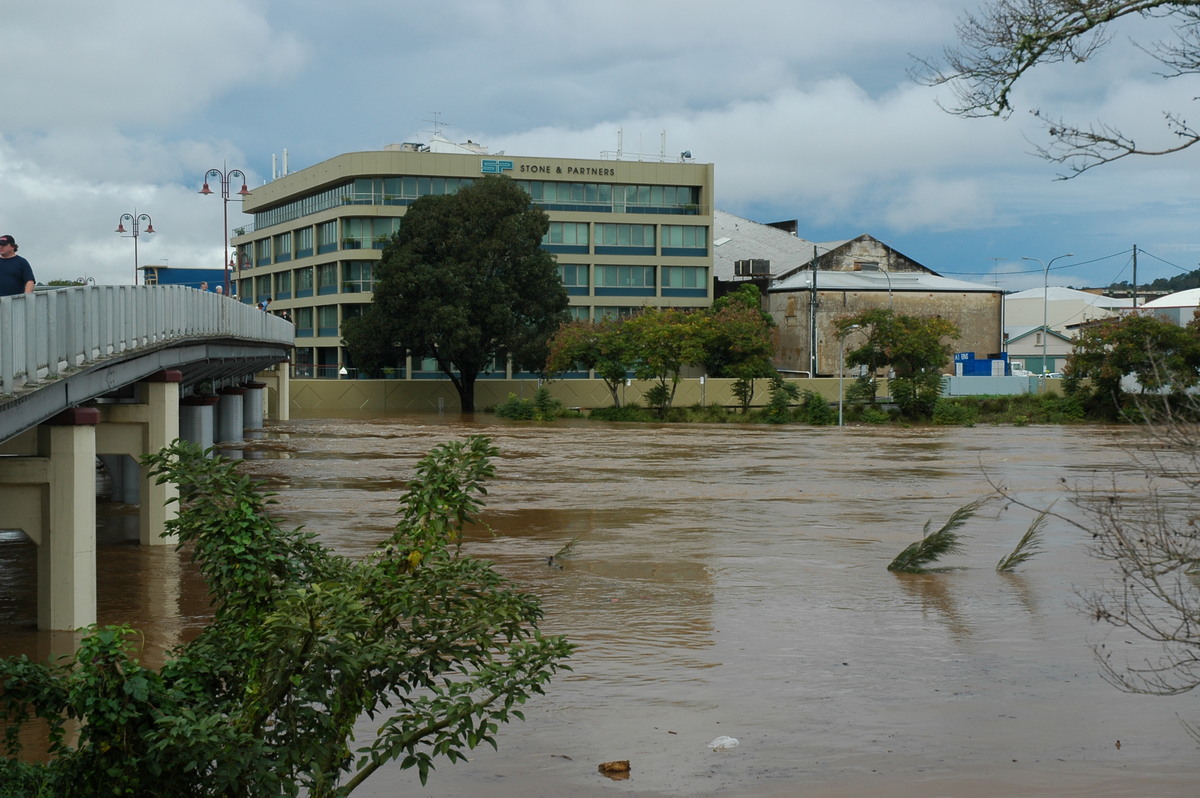
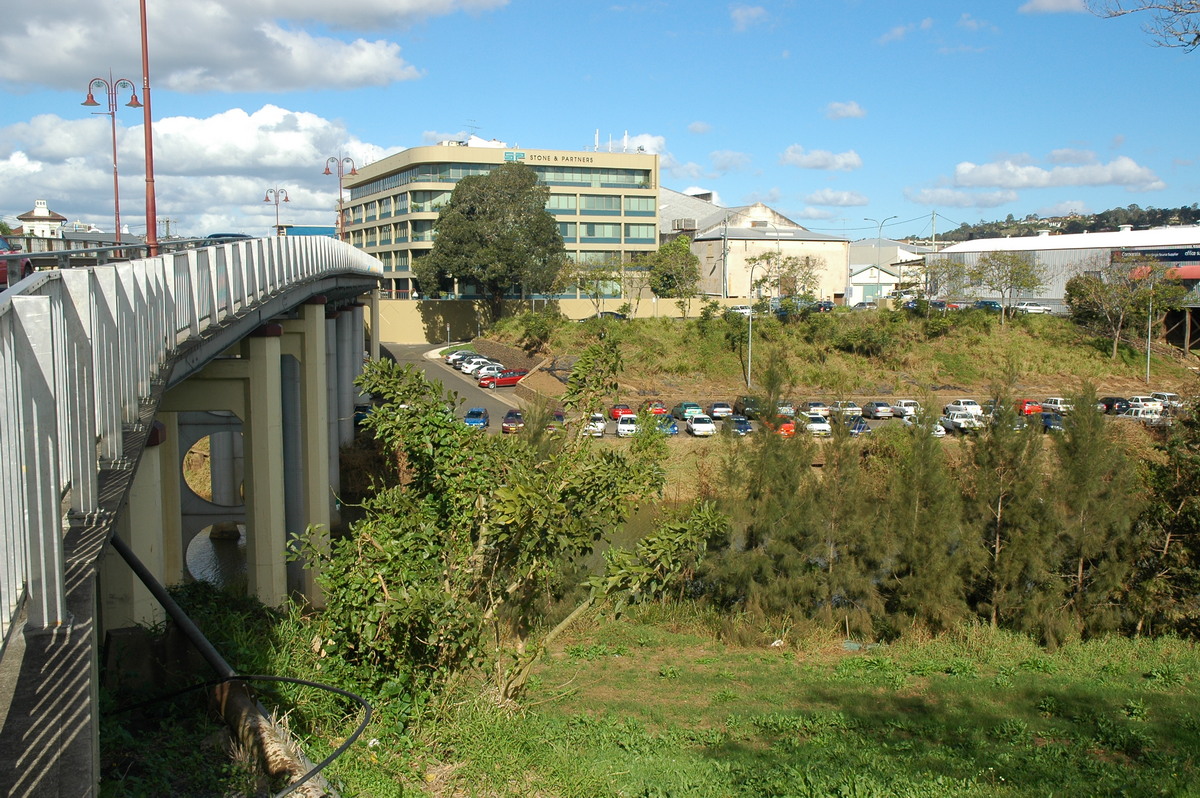
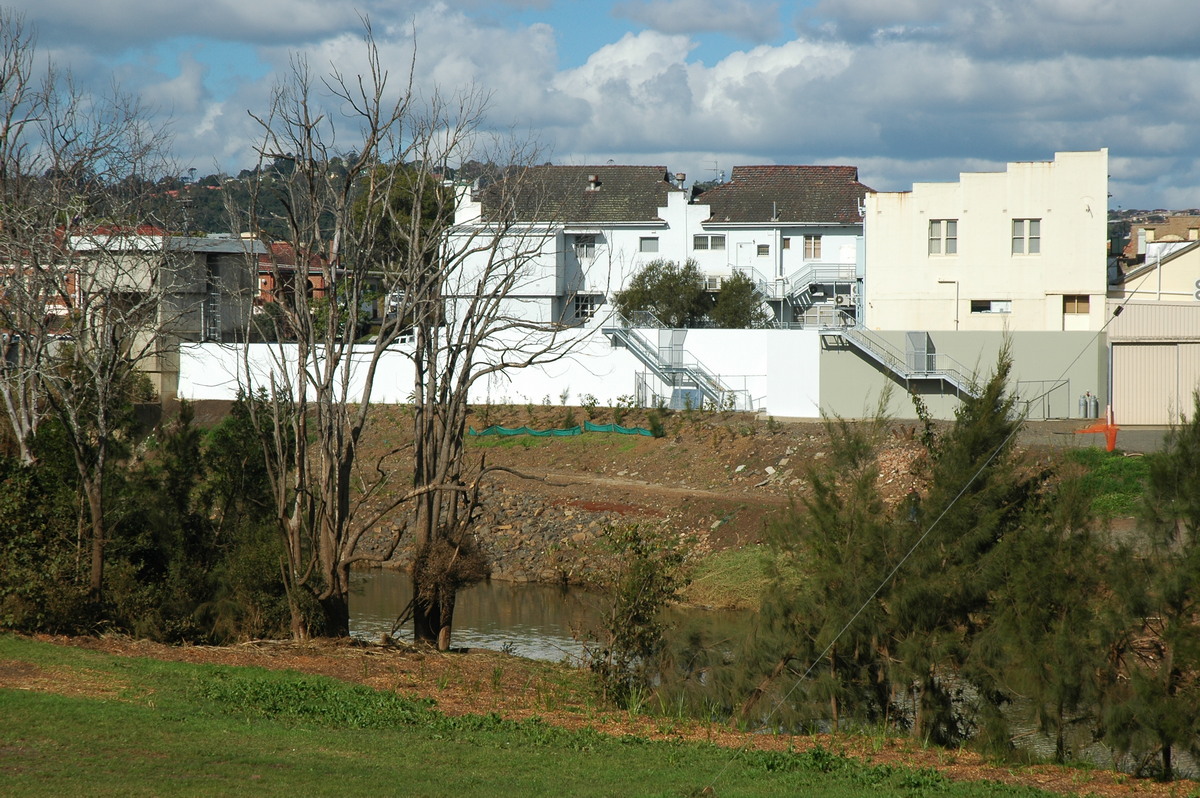
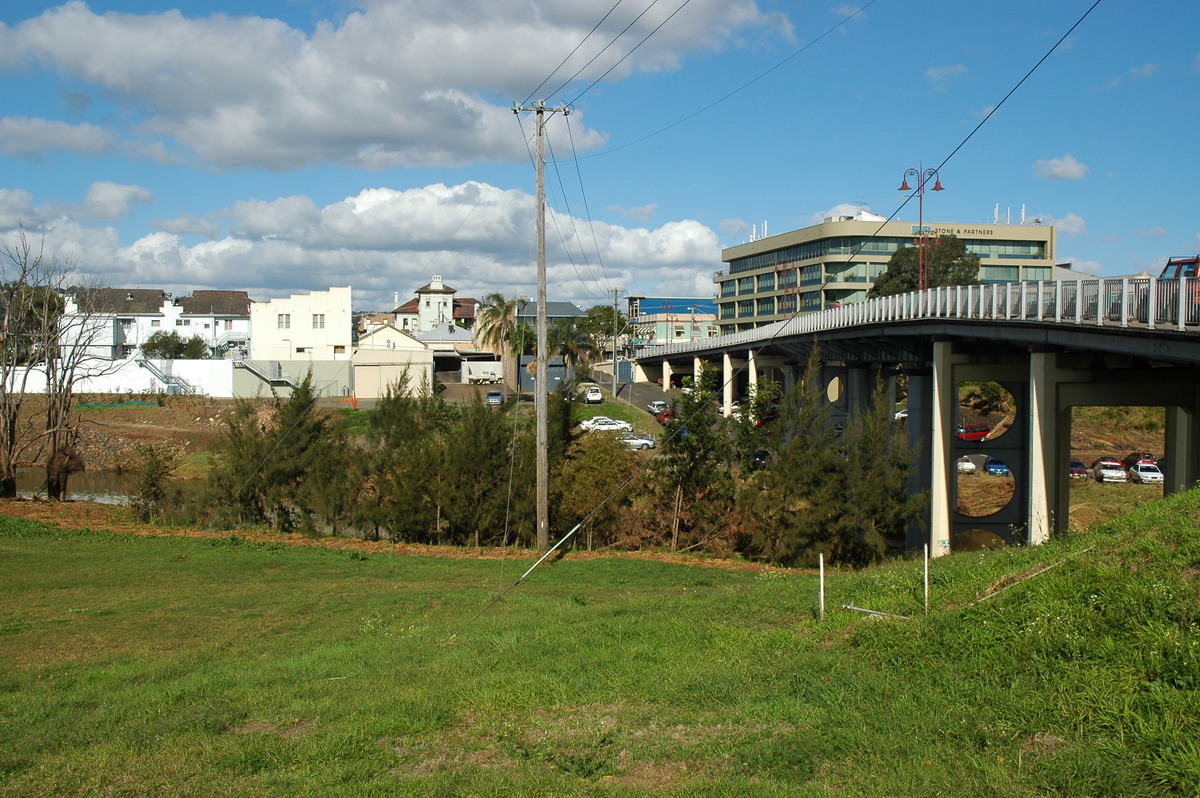
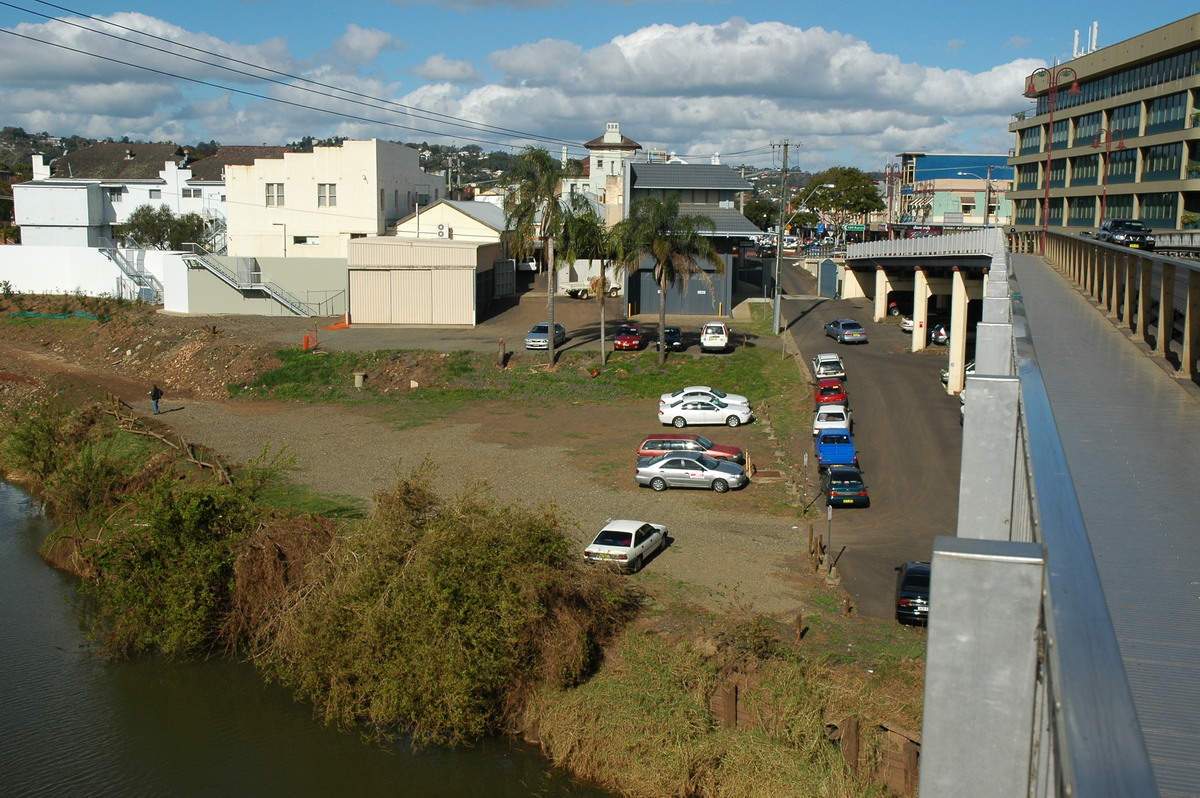
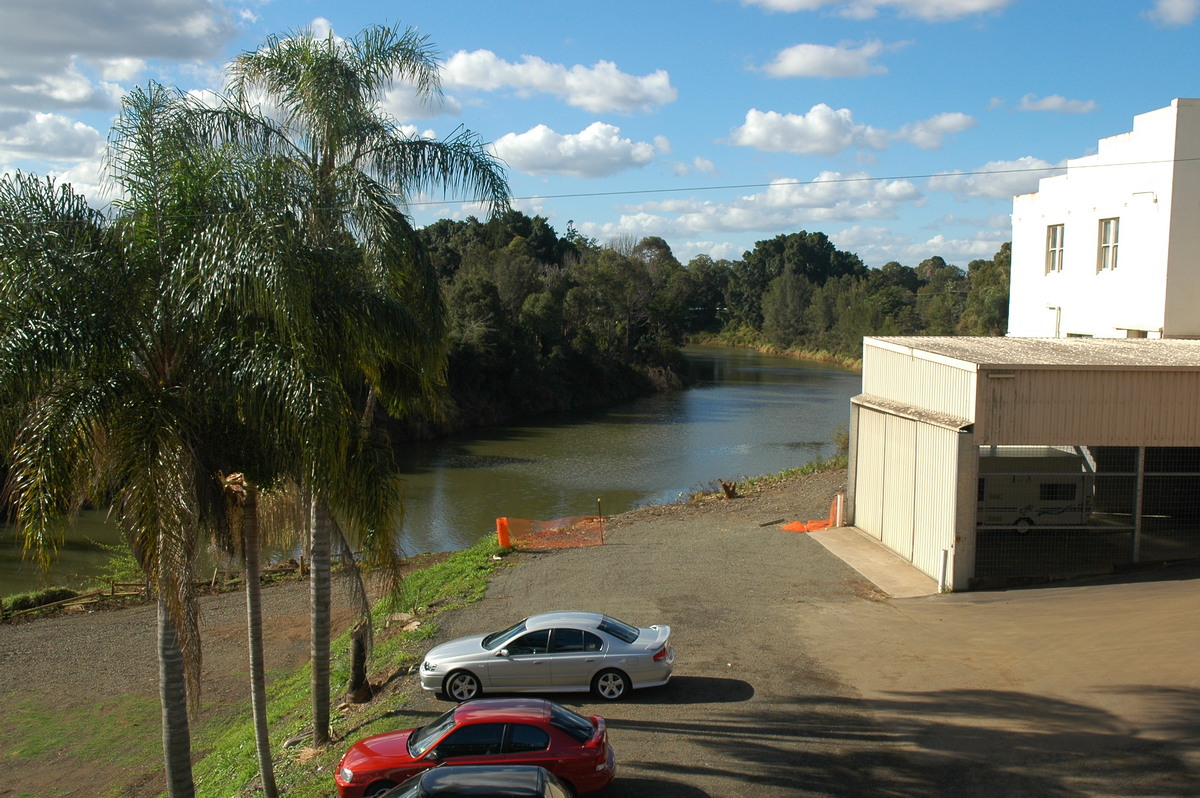
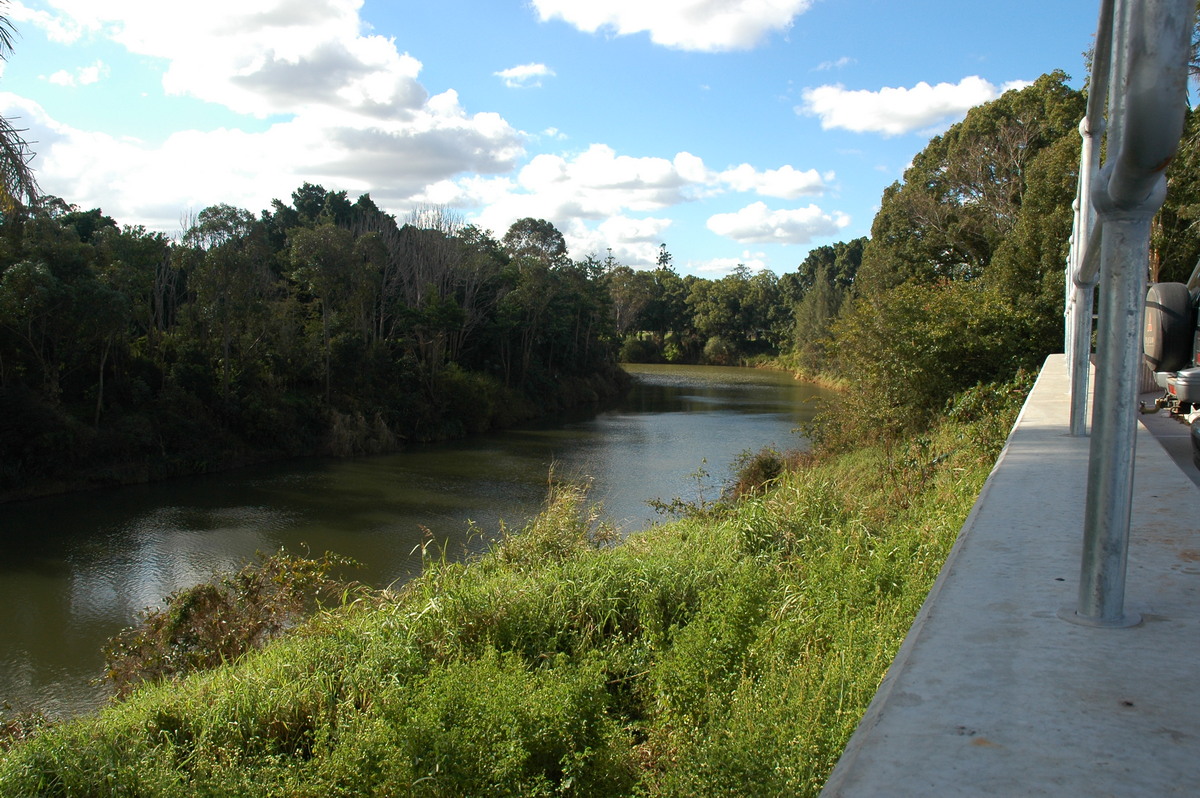
During flood and normal river flows in Lismore. Photos by Michael Bath:
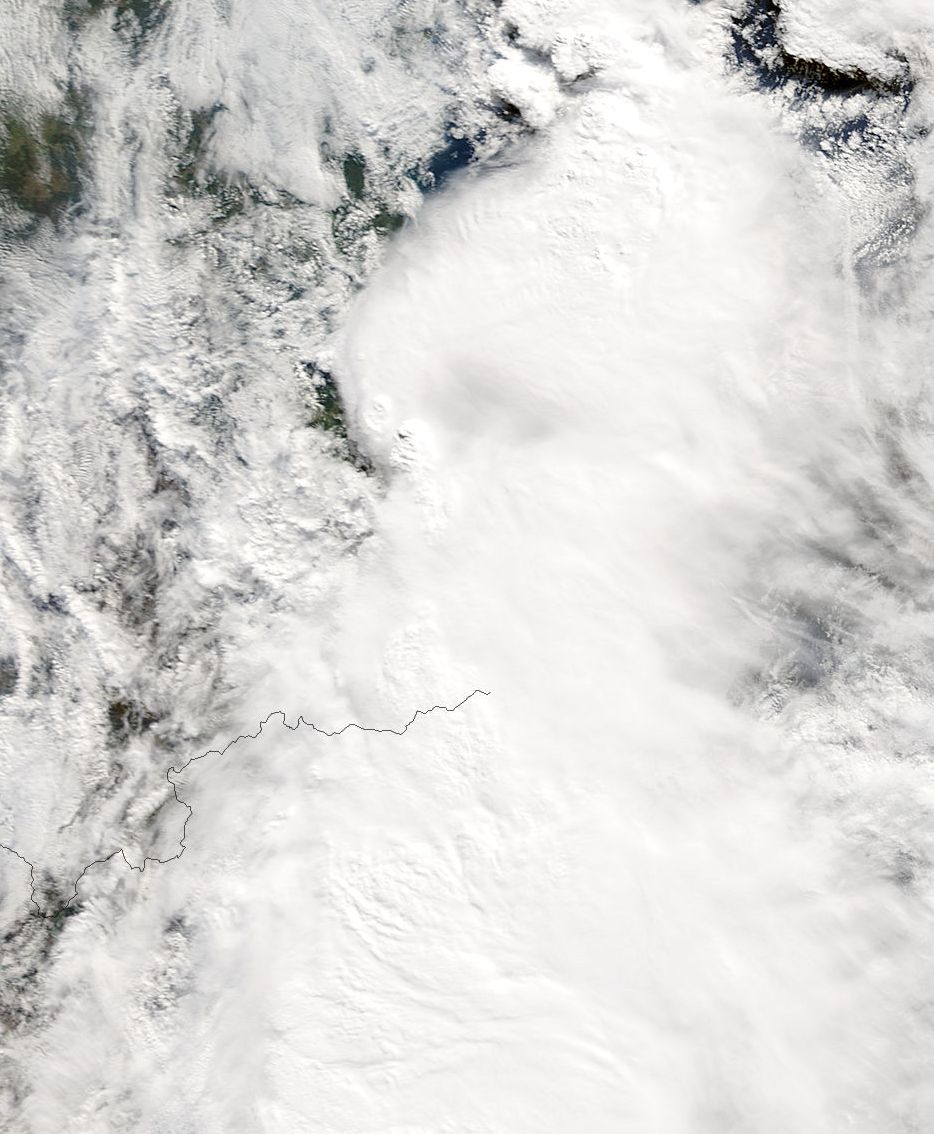
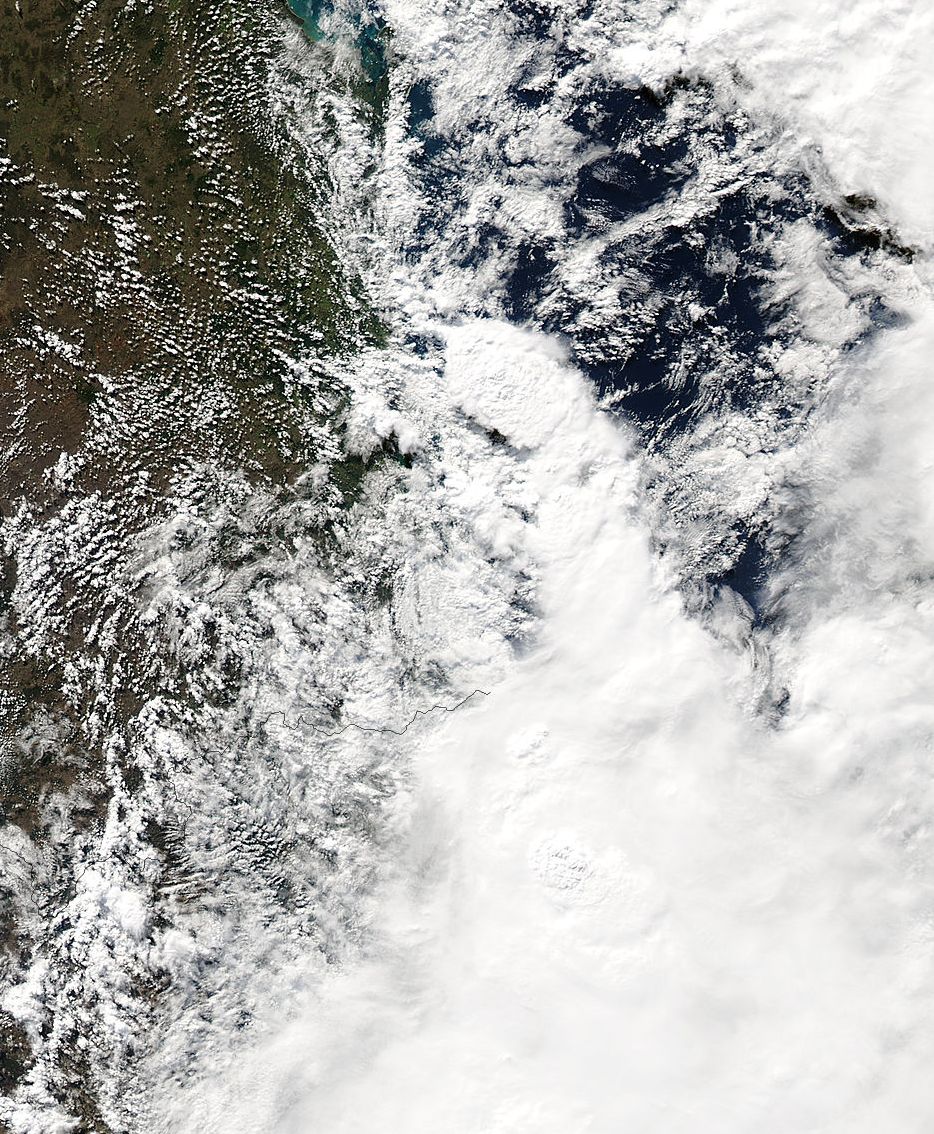
From MODIS: Land Rapid Response System:
SE QLD / NE NSW 30th June at 9.25am and 1.40pm local - click images for full sized view.
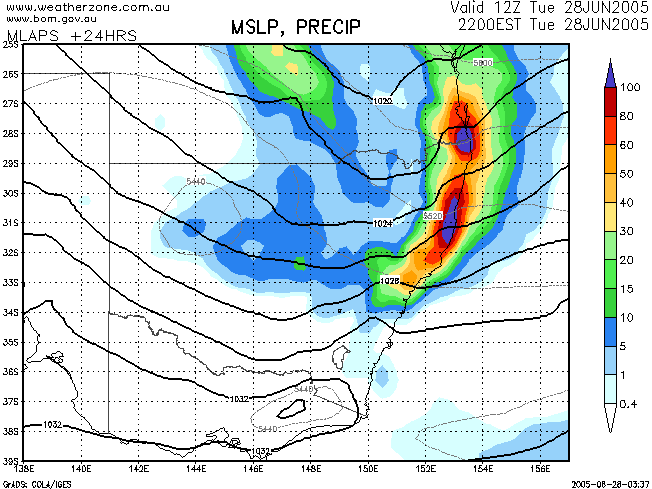
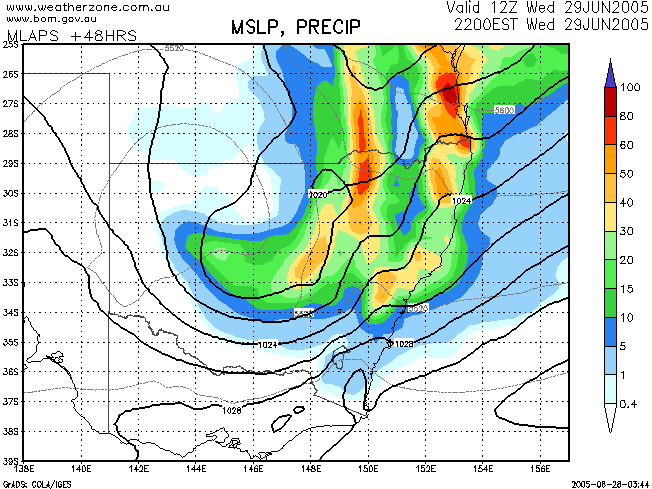
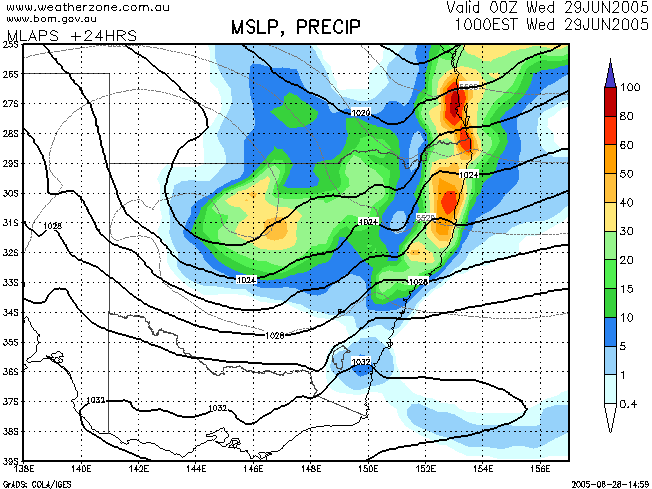
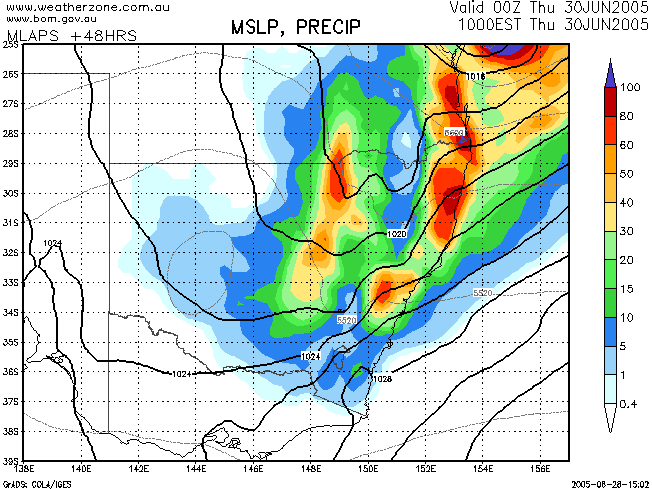
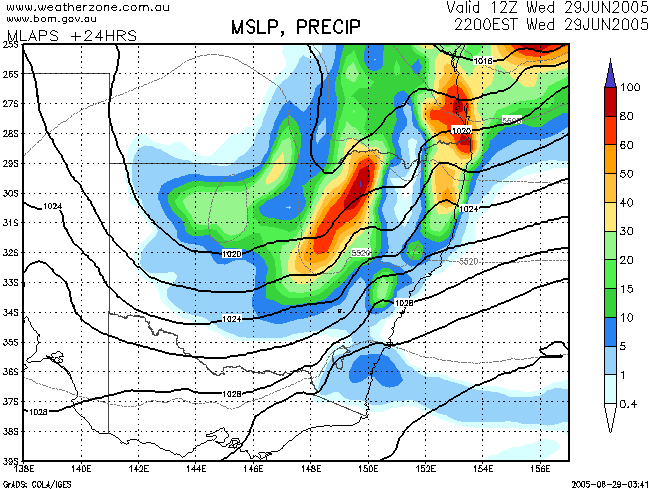
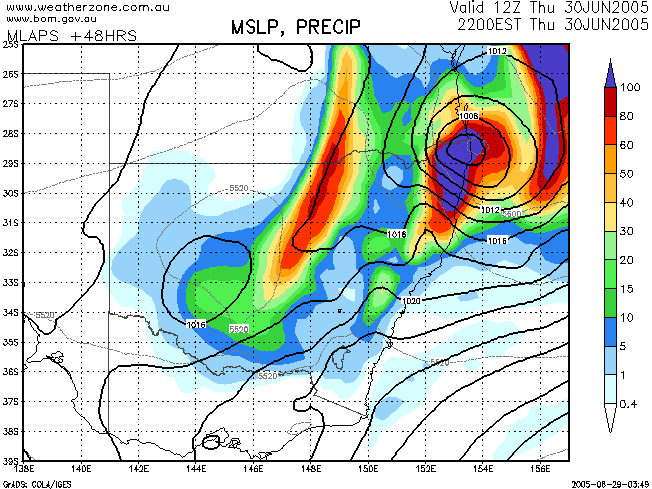
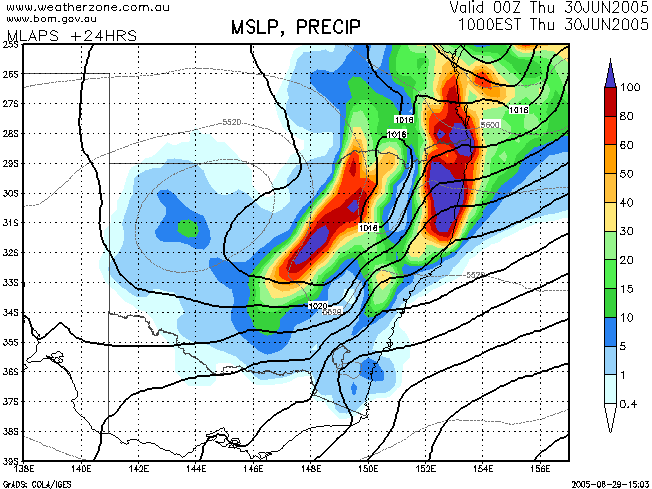
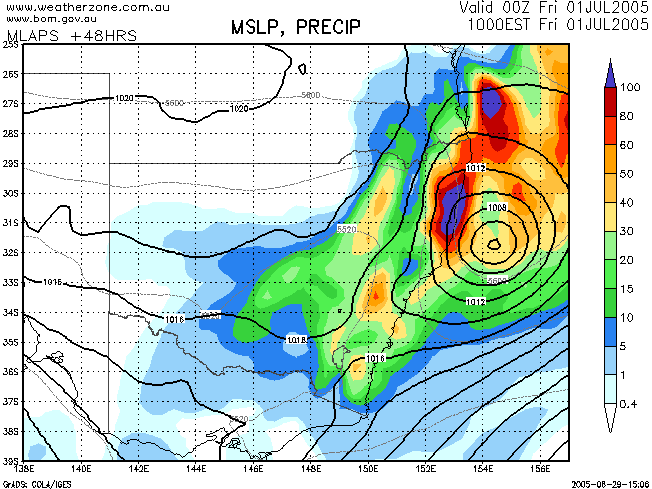
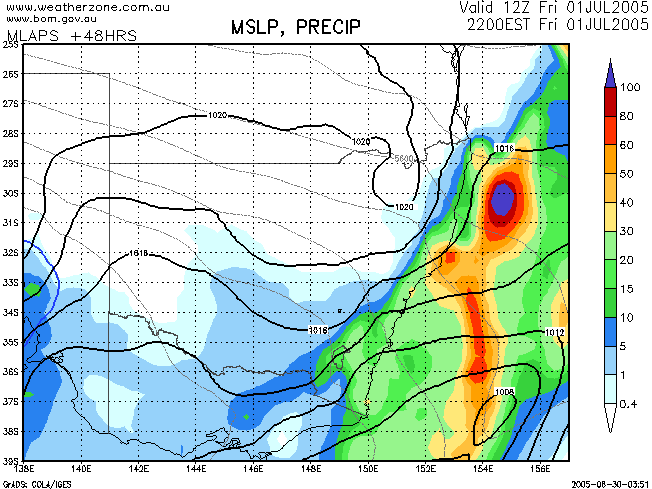
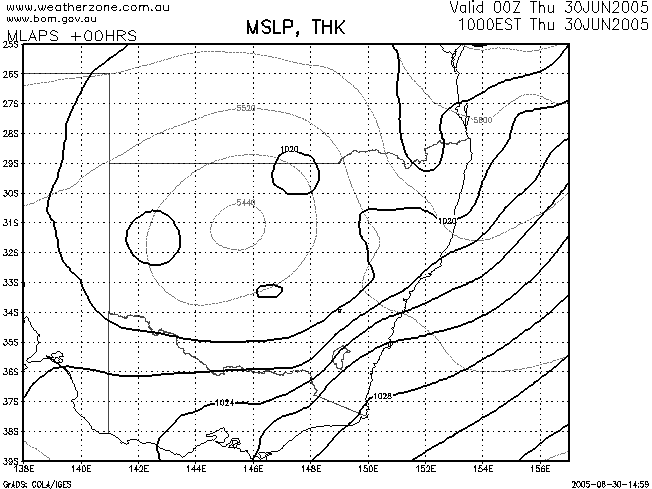
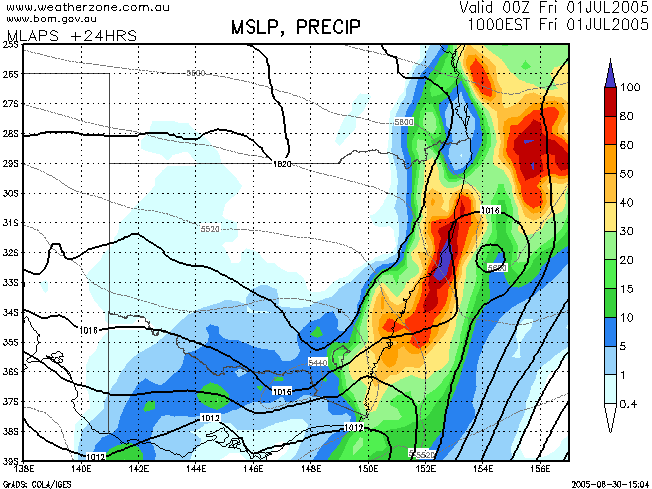
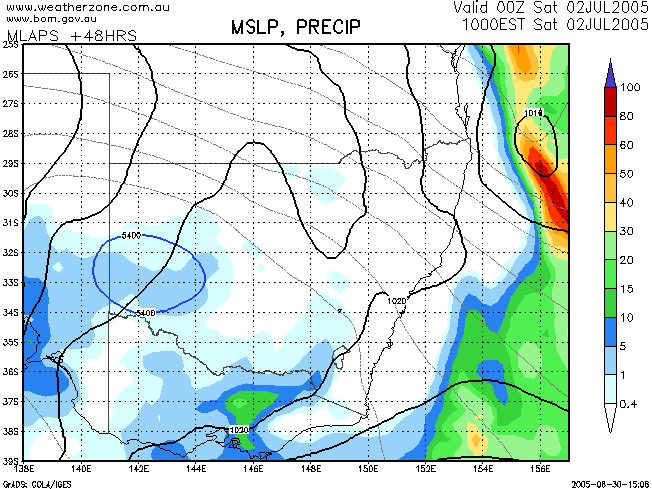
From Weatherzone and Bureau of Meteorology
Mesolaps analysis and +24 +48 forecasts over 6 runs. Click maps for full size full
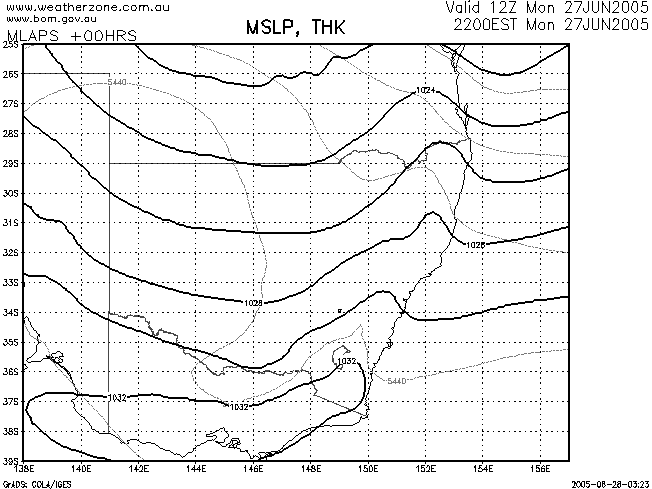
 27/06/2005 12z
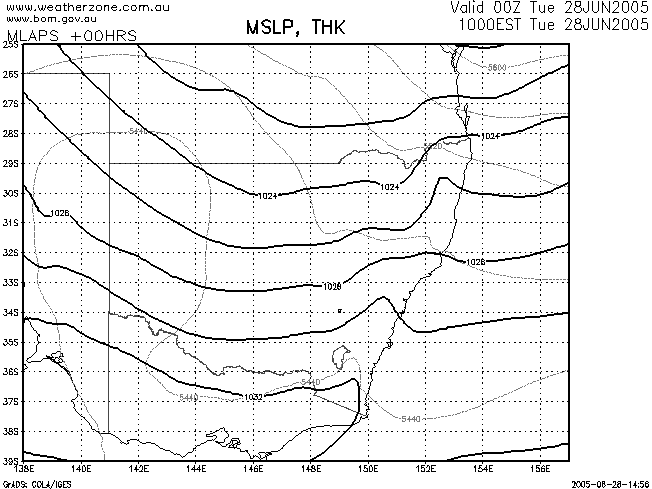
 28/06/2005 00z
 28/06/2005 12z
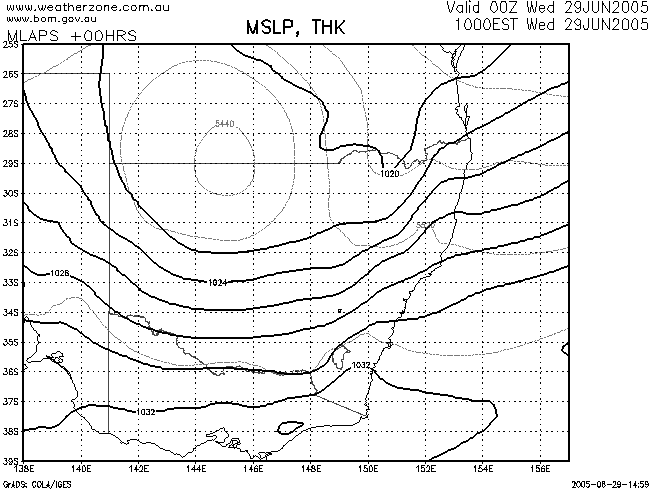
 29/06/2005 00z
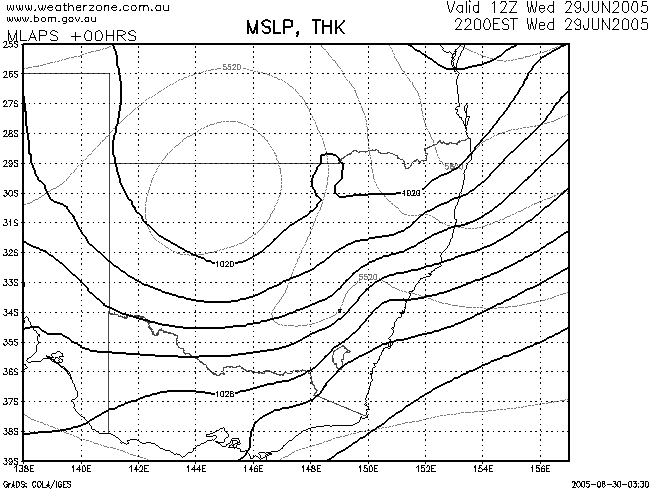
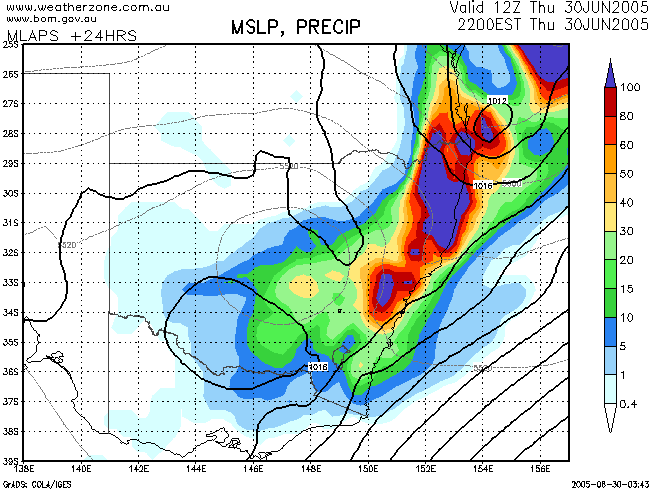
 29/06/2005 12z
 30/06/2005 00z
| |
|
||||||
|---|---|---|---|---|---|---|---|
| 25 | 26 | 27 | 28 | 29 | 30 | 1 | |
| Tweed River | |||||||
| Kunghur | 1.0 | 2.0 | 2.0 | 27 | 79 | 166 | 16 |
| Brays Creek | 0.0 | 2.0 | 1.0 | 10.0 | 79 | 78 | 0.0 |
| Bald Mountain | 0.0 | 1.0 | 4.0 | 17 | 120 | 163 | 21 |
| Uki | 0.0 | 1.0 | 6.0 | 37 | 108 | 219 | 13 |
| Eungella | 0.0 | 0.0 | 5.0 | 17 | 88 | 208 | 15 |
| Murwillumbah | 0.0 | 0.0 | 12 | 56 | 90 | 147 | 21 |
| Boat Harbour | 0.0 | 0.0 | 8.0 | 37 | 90 | 206 | 17 |
| Tumbulgum | 0.0 | 0.0 | 16 | 47 | 80 | 263 | 53 |
| Duranbah | 0.0 | 1.0 | 22 | 56 | 46 | 418 | 117 |
| Clarrie Hall Dam | 0.0 | 3.0 | 2.0 | 39 | 102 | 220 | 17 |
| Goonengerry | 2.0 | 4.0 | 11 | 44 | 187 | 344 | 23 |
| Cawongla | 0.0 | 2.0 | 3.0 | 8.0 | 37 | 144 | 7.0 |
| Eungella | 0.0 | 0.0 | 5.5 | 16 | 82 | 222 | 17 |
| Lillian Rock | 1.0 | 2.0 | 3.0 | 17 | 67 | 170 | 2.0 |
| Binna Burra | 0.0 | 0.0 | 1.0 | 5.0 | 72 | 148 | 23 |
| Springbrook | 0.0 | 0.0 | 7.0 | 15 | 136 | 203 | 14 |
| Tomewin | 0.0 | 0.0 | 19 | 37 | 137 | 253 | 21 |
| Doon Doon | 8.0 | 8.0 | 5.0 | 32 | 106 | 199 | 20 |
| |
|
||||||
|---|---|---|---|---|---|---|---|
| 25 | 26 | 27 | 28 | 29 | 30 | 1 | |
| Brunswick River | |||||||
| Chincogan | 0.0 | 1.0 | 15 | 66 | 155 | 384 | |
| Upper Main Arm | 1.0 | 4.0 | 6.0 | 48 | 159 | 263 | |
| Mullumbimby Creek | 0.0 | 1.0 | 3.0 | 28 | 164 | 340 | |
| Middle Pocket | 0.0 | 3.0 | 19 | 82 | 126 | 423 | 0.0 |
| Myocum | 1.0 | 3.0 | 13 | 52 | 156 | 323 | 6.0 |
| |
|
||||||
|---|---|---|---|---|---|---|---|
| 25 | 26 | 27 | 28 | 29 | 30 | 1 | |
| Wilsons River | |||||||
| Bentley | 0.0 | 3.0 | 4.0 | 12 | 44 | 138 | 3.0 |
| Corndale | 0.0 | 6.0 | 9.0 | 29 | 117 | 193 | 21 |
| Tuncester | 0.0 | 5.0 | 23 | 11 | 70 | 124 | 10.0 |
| Nimbin | 0.0 | 4.0 | 5.0 | 11 | 44 | 116 | 8.0 |
| Rock Valley | 0.0 | 4.0 | 6.0 | 11 | 95 | 190 | 12 |
| Cawongla | 0.0 | 2.0 | 3.0 | 8.0 | 37 | 144 | 7.0 |
| Goonengerry | 2.0 | 4.0 | 11 | 44 | 187 | 344 | 23 |
| Nashua | 1.0 | 7.0 | 10.0 | 35 | 95 | 288 | 45 |
| Repentance | 1.0 | 5.0 | 19 | 35 | 174 | 345 | 17 |
| The Channon | 0.0 | 3.0 | 3.0 | 23 | 91 | 221 | 17 |
| Doon Doon | 8.0 | 8.0 | 5.0 | 32 | 106 | 199 | 20 |
| Lillian Rock | 1.0 | 2.0 | 3.0 | 17 | 67 | 170 | 2.0 |
| |
|
||||||
|---|---|---|---|---|---|---|---|
| 25 | 26 | 27 | 28 | 29 | 30 | 1 | |
| Richmond River | |||||||
| Cawongla | 0.0 | 2.0 | 3.0 | 8.0 | 37 | 144 | 7.0 |
| Bentley | 0.0 | 3.0 | 4.0 | 12 | 44 | 138 | 3.0 |
| Rock Valley | 0.0 | 4.0 | 6.0 | 11 | 95 | 190 | 12 |
| Palen Ck | 0.0 | 0.0 | 0.0 | 1.0 | 22 | 80 | 35 |
| Darlington | 0.0 | 0.0 | 0.0 | 2.0 | 30 | 91 | 5.0 |
| Foxley | 0.0 | 0.0 | 0.0 | 1.0 | 15 | 126 | 3.0 |
| Dairy Flat | 0.0 | 0.6 | 0.0 | 3.8 | 20 | 82 | 13 |
| Loadstone | 0.0 | 4.2 | 2.4 | 5.6 | 15 | 99 | 15 |
| Urbenville | 0.4 | 1.0 | 3.4 | 5.4 | 10 | 67 | 3.6 |
| Wiangaree | 0.0 | 1.0 | 2.2 | 8.6 | 21 | 75 | 4.6 |
| Tabulam | 0.0 | 0.0 | 1.0 | 6.8 | 26 | 92 | 20 |
| Whiporie | 0.0 | 1.6 | 1.0 | 4.2 | 75 | 138 | 12 |
| Busbys Flat | 0.0 | 0.0 | 1.6 | 8.0 | 94 | 130 | 5.8 |
| Kyogle | 0.0 | 2.2 | 2.4 | 3.8 | 15 | 101 | 5.0 |
| Rappville | 0.0 | 0.0 | 2.6 | 8.6 | 84 | 118 | 8.4 |
| Yorklea | 0.0 | 2.8 | 10 | 7.0 | 71 | 148 | 8.2 |
| Casino | 0.0 | 0.4 | 8.0 | 8.0 | 58 | 141 | 3.8 |
| Evans Head | 1.8 | 8.6 | 20 | 30 | 95 | 287 | 49 |
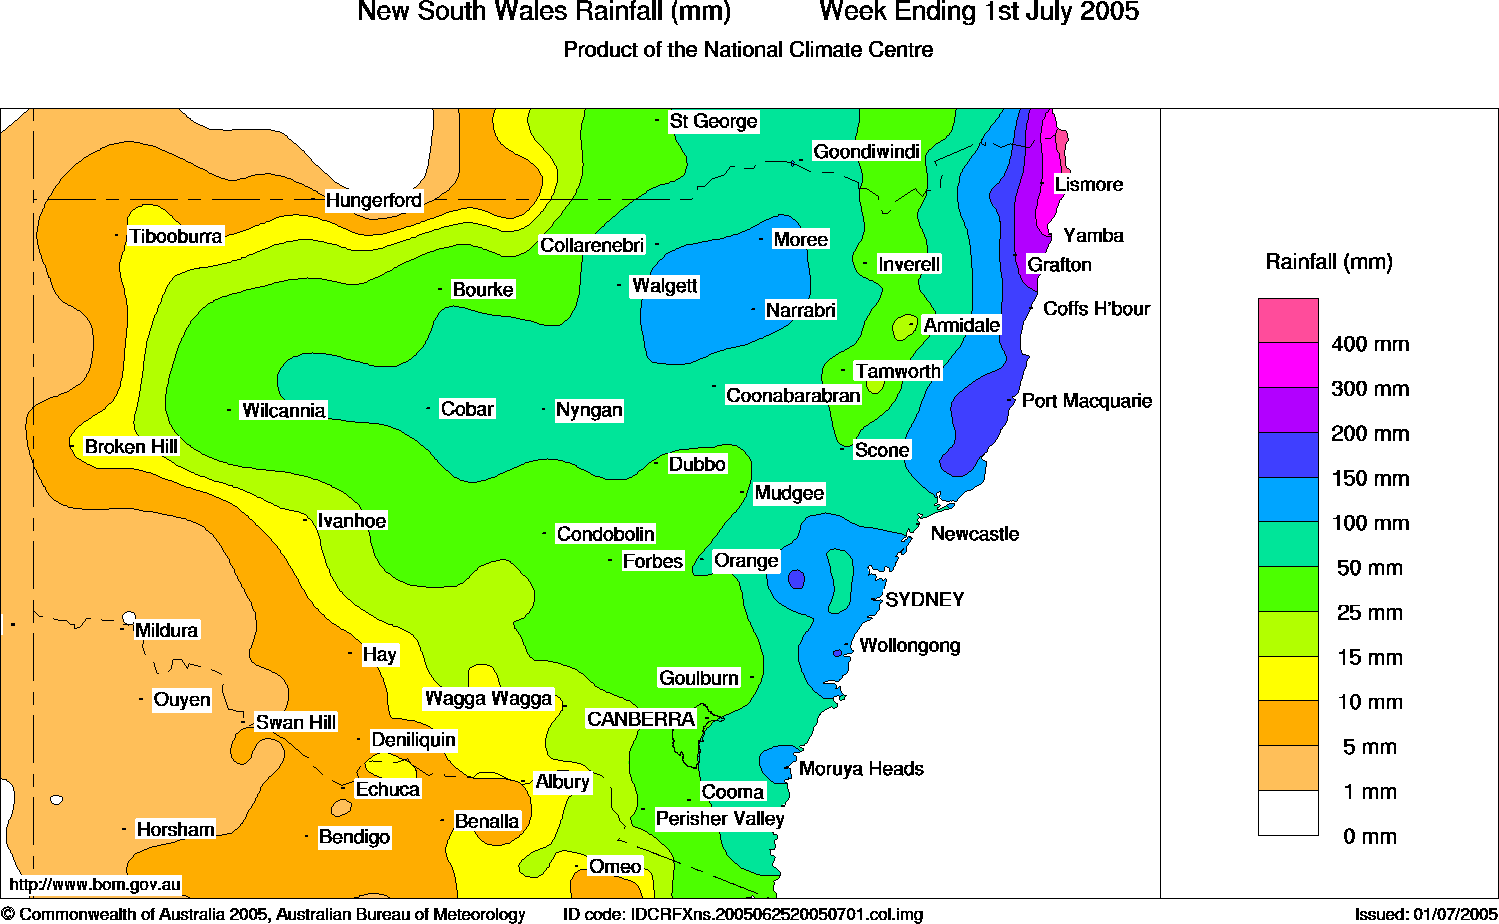
Click map for full size view of the week's rainfall.
|
Document: 200506-03.htm Updated: 29th June 2006 |
[Australian Severe Weather index] [Copyright Notice] [Email Contacts] [Search This Site] |