and Chasing
[Index][Archives]
Reality Check: A Case Study of Visual and Radar Observation of the June 12, 2003 Supercells
by Ted Best, KD5JEO, Collins County ARES
| Storm News and Chasing [Index][Archives] |
Reality Check: A Case Study of Visual and Radar Observation of the June 12, 2003 Supercells by Ted Best, KD5JEO, Collins County ARES |
Abstract
A case study of two supercells in northwest Texas is presented. Doppler WSR-88D base reflectivity radar images are compared to visual observations. The storms occurred near the dryline, and their structure and evolution is analyzed. The importance of visual observations is reinforced. Both storms showed evidence of rotation, and one showed visual evidence of a rear flank downdraft (RFD) with a brief tornado. Rotation at cloud base was visible over 30 minutes prior to the appearance of a visible funnel, but a prototypical wall cloud lowering was not observed. Although radar images show a hook echo signature for both storms, evidence for the RFD and tornado were only identifiable in visual observations of the storms. Convective outlook products provided an accurate forecast of the occurrence, timing, and evolution of the storms six hours in advance.
Introduction
Because of the physical limitations of the current Doppler radar network, visual observation of thunderstorms, or storm spotting, is an important component of the Integrated Warning System (IWS) (Doswell, 1999.) �Ground truth� is a term that meteorologists use to refer to reports from storm spotters. Direct comparison of �ground truth� and radar observation promotes a better understanding of the advantages and limitations of each.
In this paper, a case study with visual and radar observation of two supercell thunderstorms is examined. The supercell thunderstorm is defined scientifically as a thunderstorm with a persistent, rotating updraft (Doswell, 1990.) Visually distinct variants of the supercell are discussed in the literature, but are more difficult to define with precision, and collectively represent a spectrum of characteristics defined primarily by the amount and location of visible precipitation with respect to the updraft (Doswell, 1990.) The three supercell types commonly referred to in increasing order of visible precipitation are low precipitation (LP) (Bluestein and Parks, 1983), classic (Moller, 1994), and high precipitation (HP) (Moller, 1990.) In addition to visible differences, these storm types may also show recognizable differences in radar reflectivity signatures. In the case of LP supercells, limited precipitation may make them difficult to identify by radar reflectivity alone (Moller, 1994.) The storms in this case study show characteristics of the LP and classic types.
In addition to the spectrum of supercell characteristics, it is recognized that supercells are not static entities, but that they may evolve over time (Doswell, 1990.) Characteristics of a supercell are related to the environment in which they form, and their evolution can be influenced by a variety of factors, including changes in their environment. One such change may be the evolution of other storms in their proximity. In this case study, two supercells evolved in close proximity to each other.
Setting the Stage
June 12, 2003 was an active weather day across north Texas. A linear, north-south mesoscale convective system (MCS) moved across the area between 0300 UTC and 0900 UTC, and by 1500 UTC, another MCS cluster was developing in southern Oklahoma, centered near Ardmore (ADM). By 1730 UTC, the leading edge of the second MCS became more linear and was crossing the Red River, moving south with a west-east orientation. The second MCS was important in establishing an outflow boundary that would later help
to focus stronger, more isolated convection in northwest Texas ( Fig. 1. ) The same area in northwest Texas had been undergoing rapid heating under clear skies for most of the morning.
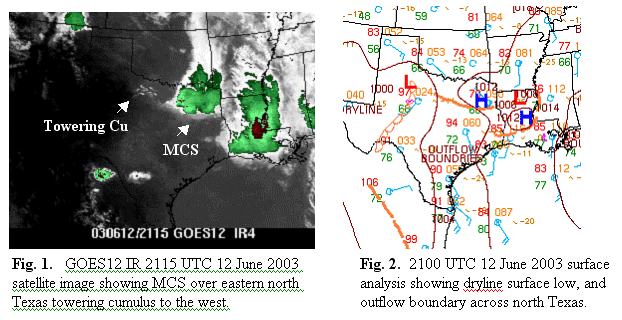
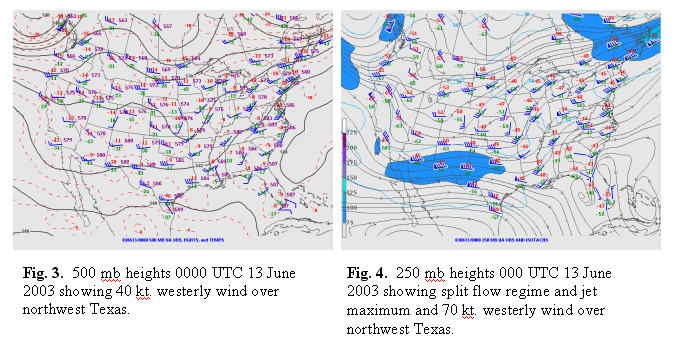
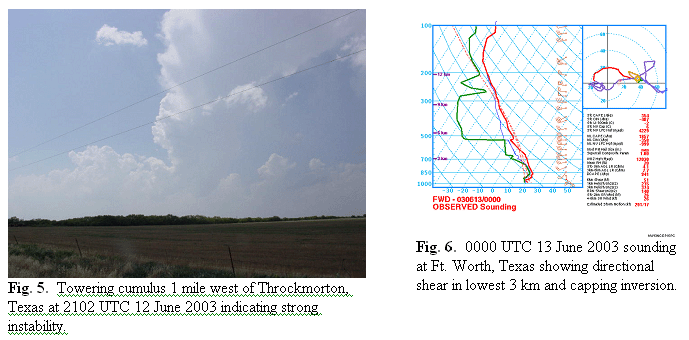
In addition to outflow boundaries, there were several influences that would aid strong convection in northwest Texas. On the synoptic scale, a split flow regime was in place over the continental US with a southern stream 100 knot jet max (streak) over Midland, Texas (MAF) at 1200 UTC, placing northwest Texas in the left exit region of the jet streak by mid-afternoon ( Fig. 4 .) Upward vertical motion is favored in the left exit region of the jet streak (Johnson and Mapes 2001.) Winds at the 500 mb level were 40 knots ( Fig. 3 ) and 70 knots at 250 mb ( Fig. 4 ) at 0000 UTC 13 June 2003. The surface dryline, which had retreated into far west Texas overnight, mixed eastward rapidly under strong surface heating to near a Childress-San Angelo (CDS-SJT) line by late afternoon (2100 UTC) with an eastward �bulge� into northwest Texas ( Fig. 2 .) A surface low over west Texas was driving southeasterly surface winds ahead of the dryline with a pressure fall of 1.6 mb in 3 hours at Abilene, Texas. A moisture axis with upper 60s F dewpoints at the surface extended north to Altus, Oklahoma (LTS), and rich moisture was evident on the 850 mb analysis with 20 C dewpoints. A capping inversion at 850 mb (approx. 1.5 km) also appeared on the Ft. Worth 0000 UTC 13 June 2003 sounding ( Fig. 6 .)
The Storm Prediction Center Day 1 Convective Outlook issued at 1630 UTC indicated that � more significant convection is expected to develop late this afternoon as the air mass south of the Red River boundary and east of the dryline become extremely unstable��deep layer shear around 35 kts should support supercells with very large hail�damaging winds, and perhaps a tornado or two during the first few hours after initiation. �
Storm Scale Observations
The intersection of dryline and outflow boundary was analyzed in northwest Texas near Throckmorton. The 1940 UTC measured surface temperature at Graham, Texas, 30 miles (48 km) east of Throckmorton, was 92 F with a dewpoint of 74 F. At 2120 UTC in Throckmorton, the temperature measured 95 F with a dewpoint of 67 F. Towering cumulus were visible north of Throckmorton with anvils ( Fig. 5 ). Cumulus were also visible on the 2115 UTC IR satellite image ( Fig. 1 ). With temperatures east of the dryline warming into the lower 90s F in northwest Texas, MLCAPE values reached 4000 j/kg. 0-6 km shear values reached 35 knots, marginally sufficient for supercell rotation, but the Ft. Worth sounding (160 km southeast) indicated strong directional shear in the 0-3 km layer ( Fig. 6 ). The first storm (referred to here as the Olney, Texas supercell) that began to show evidence of storm scale organization was approximately 20 miles (30 km) northeast of Throckmorton. Visual observation at 2137 UTC showed a weak anvil and low level inflow indicated by low clouds. At 2150 UTC, a flared rain-free base was observed from a closer vantage point.
Based on the 2120 UTC surface temperature and dewpoint at Throckmorton, the lifting condensation level (LCL) was estimated to be 1558 m (1.56 km) above ground level (AGL.) This is a relatively high value and represents an above average LCL compared to all supercells studied by Rasmussen and Blanchard (Rasmussen and Blanchard, 1998.) Their study examined 6000 soundings from 1992 and found in part that supercells producing significant tornadoes (F2 or greater) have lower LCLs than those that produce only large hail (2 in. diameter or greater.) In their study, the average LCL for a supercell with a significant tornado was 0.78 km compared to 1.23 km for supercells without, although these numbers may vary significantly on the thunderstorm scale (Rasmussen and Blanchard, 1998.) Markowski, for example, using data from VORTEX, found that storm-relative helicity (SRH) varies significantly over small space and time scales (Markowski, 1997.)
Olney Supercell: Visual and Radar Observation
The Ft. Worth, Texas WSR 88D Doppler radar site (KFWS) was approximately 100 miles (160 km) southeast of the storms. With a base reflectivity tilt of 0.5 degrees, the altitude of the radar beam was approximately at the 3 km level in the storms. For simplicity, only base reflectivity images from Ft. Worth are presented here. The base reflectivity images offer an important but limited view of the storm structure.
Precipitation cores from both storms first appeared on the 2201 UTC radar mosaic image. In the previous image at 2133 UTC, no organized precipitation echoes were visible. The eastern cell (Olney supercell) first showed a radar precipitation core near Olney, Texas. A flared rain free base was visible as early as 2150 UTC. The first visible precipitation appeared at 2204 UTC, corresponding to the first Doppler radar image of the storm at 2201 UTC. A spotter report of 1 inch diameter hail was made at 2214 UTC. At 2216, evidence of a clear slot and associated rear flank downdraft (RFD) subsidence had appeared, and rotation was seen under the rain free base in weakly organized cloud fragments, but a distinct lowering or wall cloud failed to materialize. The lack of a lowering or wall cloud in this case may indicate a weak low level mesocyclone or dry inflow resulting from a weak precipitation core, but in either case, the storm showed persistent visible evidence of rotation.
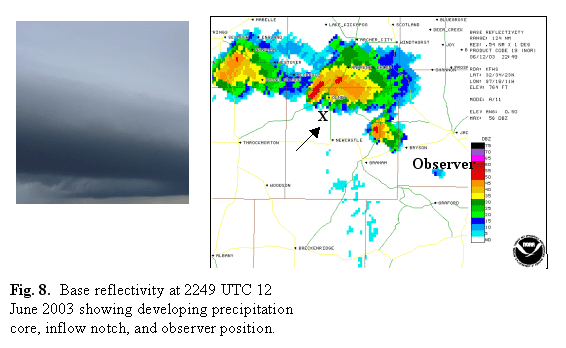
The storm persisted for another 30 minutes, gradually forming a more defined clear slot and inflow band. At 2250 UTC a distinct clear slot and �horseshoe� updraft formation were visible ( Fig. 7 .) Although the hook echo is characteristic of storms with a mesocyclone (Burgess and Ray 1986), the RFD may be difficult or impossible to detect in the base reflectivity images. The 2249 UTC radar base reflectivity image shows no evidence of an RFD, but a distinct hook echo and inflow notch were apparent on the radar image near Olney, Texas ( Fig. 8 .)
Fig. 7. Looking north at 2250 UTC 12 June 2003 with precipitation and clear slot.
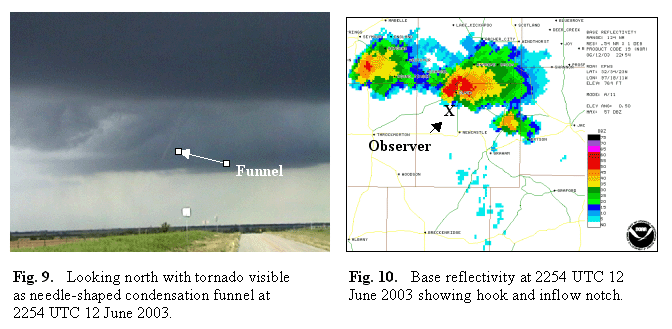
On the 2254 UTC radar image, precipitation had intensified around the hook formation ( Fig. 10 .) A brief tornado was observed near the clear slot at 2254 UTC, 36 minutes after recognition of rotation at the storm base ( Fig. 9 .) Although the tornado was brief (<30 seconds) and barely visible, spotters verified a touchdown 4 miles (6 km) west of Olney. Hail (1.75 inch diameter) was reported at 2255 UTC 2 miles (3 km) west of Olney under the main precipitation core. At the same time, precipitation was visible north of the rain-free base, and the storm had taken on a classic supercell appearance.
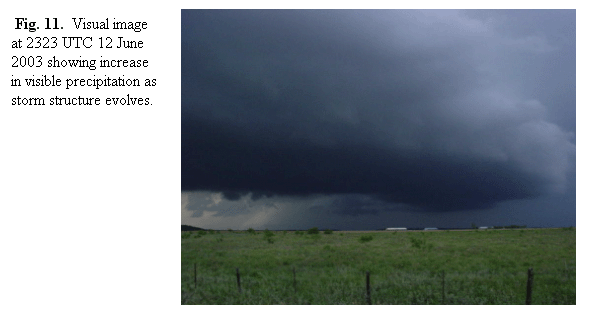
Over the following 30 minutes, the storm became less organized in appearance, and by 2323 UTC, the precipitation core had intensified visually ( Fig. 11 .)
Young County Supercell
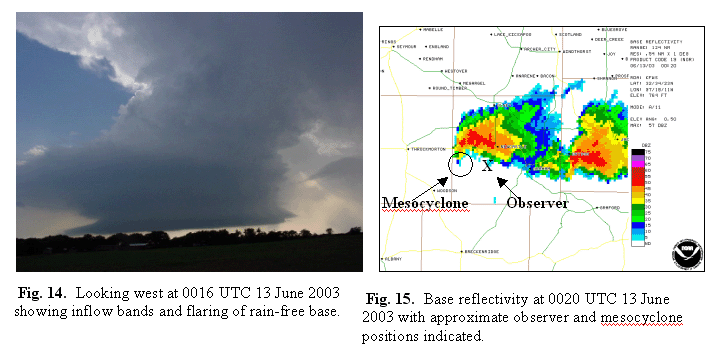
Approximately 15 miles (24 km) west of the Olney supercell, a second and equally persistent storm was visible on radar images. Initially, the Young County supercell showed a smaller reflectivity core on radar ( Fig. 8 ), more typical of a low-precipitation (LP) supercell, but the reflectivity core grew substantially in just over one hour ( Fig. 15 .) Visually, the Young County storm showed some characteristics of an LP supercell, pronounced striations, flared base, compact updraft tower, and weak visible precipitation, but at times, the visible precipitation curtain ( Fig. 12) was more indicative of a classic supercell. Radar images, ( Fig. 13 and 15 ) were also more indicative of a classic supercell.
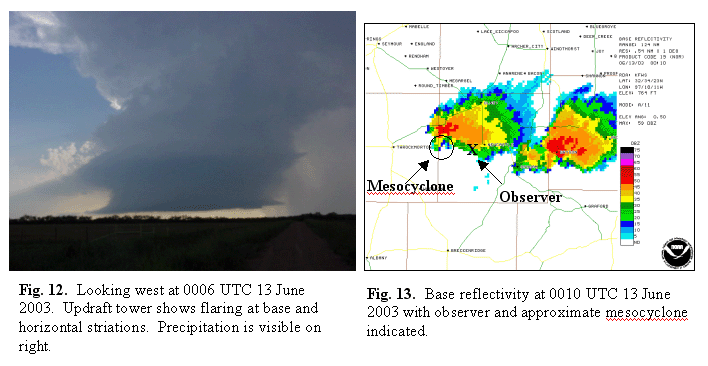
The Young county storm maintained a visually distinct rotating updraft tower for more than one hour. During this time, the visible precipitation curtain was at times visibly opaque ( Fig. 12 ) and at other times more transluscent ( Fig.14 .) The storm showed pronounced horizontal striations and mid-level inflow bands ( Fig. 14 .) Although time-lapse video revealed updraft rotation, no wall cloud or tornado was observed. The smooth appearance of the lower third of the updraft tower may indicate forced ascent through a capping inversion layer. By 0020 UTC there was a significant increase in the size of the precipitation core on the radar image ( Fig. 15 ) compared to the first image at 2249 UTC ( Fig. 8 .) The storm moved slowly southeastward and produced 1.75 inch diameter hail at 0042 UTC in Newcastle, Texas.
Storm Interaction
The proximity of the two supercells in this case may have played an important role in their evolution. The Olney supercell developed a much larger and more intense reflectivity core (at the 3 km level) than the Young county storm. We can only speculate that part of the reason for the larger and more intense precipitation core on the Olney storm was a result of ice crystal seeding from the Young County cell. Anvil level winds were west or west-northwest which may have pushed some of the Young County anvil into the Olney storm. Another important variable is storm relative wind. The Young County storm may have obstructed the mid level winds and effectively decreased the storm relative winds seen by the Olney storm. The weaker storm relative winds on the Olney storm may have allowed more precipitation to fall near the updraft ( Fig. 11 ) as opposed to less visible precipitation in proximity to the updraft in the Young County storm ( Fig. 12. ) The difference is also observed in the radar signatures ( Fig. 10 and Fig. 15 .) Increased precipitation and storm-relative helicity (SRH) may have been important for tornadogenesis in the Olney storm.
The proximity of the two cells stayed approximately constant over an 80 minute time scale at about 33 miles (53 km.) The motion was also about equal with a southeasterly direction of travel (120°) at approximately 24 mph (38 km/h.) Using the 0000 UTC 13 June 2003 Ft. Worth sounding ( Fig. 6 ), this direction is to the right of the 0-6 km mean wind shear as expected. A motion vector to the right of the mean wind shear is expected for a clockwise turning hodograph (Weisman and Klemp 1986.)
Conclusions
An active severe weather scenario produced a two supercell thunderstorms in close proximity that showed characteristic rotation and persistence. Visual observation revealed storm characteristics that were not seen in Doppler radar base reflectivity images including a rear flank downdraft with associated clear slot, and a brief tornado. The storms formed in an environment that produced relatively high LFCs, which have been shown to be less favorable for tornado occurrence. In spite of the high LFC, one storm produced a brief tornado. Tornado precursors including an RFD and rotation at storm base were identified visually 30 minutes prior to the tornado sighting, although another common visual precursor, the wall cloud, failed to fully develop in either storm. Interaction between the storms may explain some of the differences in visual structure and evolution with the downwind storm producing more visual precipitation near the updraft base. Visual observations verified the SPC 1630 UTC Convective Outlook which called for late afternoon storm initiation in northwestern Texas, supercells with large hail, and potential for tornadoes during the first few hours after storm initiation.
Acknowledgements
I wish to thank Al Moller for his review of an earlier version of the manuscript, insightful comments, and discussion on this event. I would also like to thank John Kobar of the National Climatic Data Center for his assistance in retrieving radar images. I am also grateful to Skip Ely for his review of an earlier version and three additional reviewers, Larry Page, Bill Ice, and Jack Hopka. I am appreciative for the efforts of the Storm Prediction Center to provide, via the Internet, upper air, satellite, and surface images used in this paper. My thanks also go to Jimmy Deguara whose storm intercept skills contributed greatly to our ability to observe the storms at the right time and place. You also have a great opportunity to buy a case study at EffectivePapers.com online.
References
Bluestein, H.B., and C.R. Parks, 1983: A Synoptic and Photographic Climatology of Low-Precipitation Severe Thunderstorms in the Southern Plains. Monthly Weather Review , 111, pp. 2034-2046.
Burgess, D., and P. S. Ray, 1986: Principles of Radar. Mesoscale Meteorology and Forecasting, Ed. by P.S. Ray, American Meteorological Society, Boston, 85-117.
Doswell, C.A. III, A.R. Moller, and H.E. Brooks, 1999: Storm Spotting and Public Awareness Since the First Tornado Forecasts of 1948. Weather and Forecasting , 14 , pp.544-557.
Doswell, C.A. III, A.R. Moller, and R.W. Przybylinski, 1990: A Unified Set of Conceptual Models for Variations on the Supercell Theme. Preprints, 16 th Conference on Severe Local Storms, Kananaskis Park, Canada, American Meteorological Society, Boston.
Johnson, R. H., and B. E. Mapes, 2001: Mesoscale Processes and Severe Convective Weather. Severe Convective Storms, Ed. by C.A. Doswell III, American Meteorological Society, Boston, 71-122.
Markowski, P.M., J.M. Straka, E.N. Rasmussen, and D.O. Blanchard, 1998: Variability of Storm-Relative Helicity during VORTEX. Monthly Weather Review, Vol. 126, pp. 2959-2971.
Moller, A. R., 2001: Severe Local Storms Forecasting. Severe Convective Storms, Ed. by C.A. Doswell III, American Meteorological Society, Boston, 433-480.
Moller, A. R., C. A. Doswell III, M. P. Foster, and G. R. Woodall, 1994: The Operational Recognition of Supercell Thunderstorm Environments and Strom Structures. Weather and Forecasting, Vol. 9, 327-347.
Moller, A.R., C.A. Doswell III, and R. Przybylinski, 1990: High-Precipitation Supercells: A Conceptual Model and Documentation. Preprints, 16 th Conference on Severe Local Storms, Kananaskis Park, Canada, American Meteorological Society, Boston.
Rasmussen, E.N., and D.O. Blanchard, 1998: A Baseline Climatology of Sounding-Derived Supercell and Tornado Forecast Parameters. Weather and Forecasting , Vol. 13, pp. 1148-1164.
Weisman, M. L., and J. B. Klemp, 1986: Characteristics of Isolated Convective Storms. Mesoscale Meteorology and Forecasting, Ed. by P.S. Ray, American Meteorological Society, Boston, 331-358.
|
Document: 200305-01.html
Updated: 28th January, 2005 |
[Australian Severe Weather index] [Copyright Notice] [Email Contacts] [Search This Site] |